Dogecoin’s structure “is still trying to turn around,” according to a market technician More Crypto Online who argues that both the higher-time-frame and intraday counts now permit a constructive path toward $0.60—provided a handful of support and breakout thresholds hold. In a new video, the analyst describes a market that is “printing higher highs and higher lows,” but cautions that the advance is “choppy, slow… boring and very fragile,” language that underscores how conditional the bullish setup remains.
Dogecoin Breakout Loading
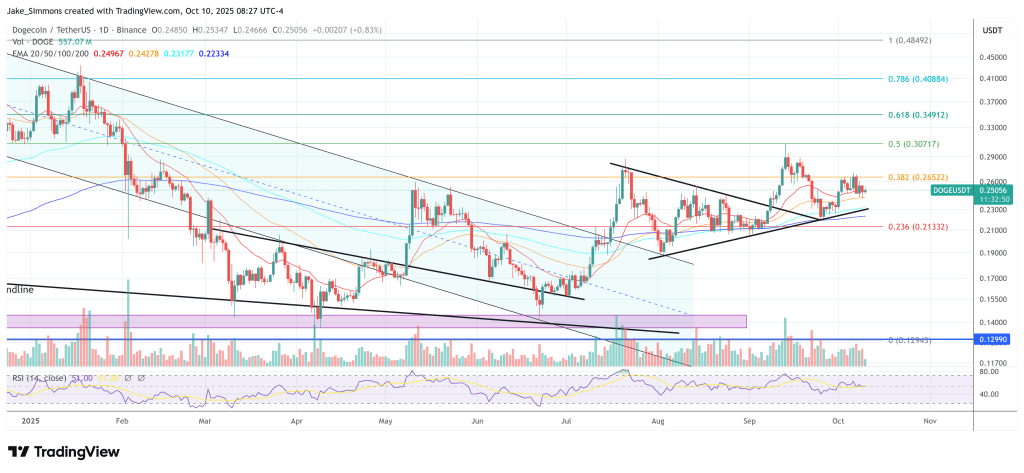
On the daily chart, the crux of the thesis is the integrity of August’s corrective low, labeled as the wave-2 pivot. “From a daily chart point of view [price] should really… ideally hold above the wave 2 low that formed here in August,” the analyst says, calling that local invalidation line at $0.189.

A decisive violation would force a re-marking of the larger structure: “If we break below this red line, the idea that a B-wave bottomed in June will have to be revised.” Even so, the commentator preserves a secondary bullish path, noting that an extended B-wave could still be in play as “a broader A-B-C structure,” with the market attempting another reversal “from the lower support area” thereafter.
Upside conviction rotates around September’s swing high. “Once we break above the last swing high from September, we might be on our way to $0.49+,” the analyst says. That level functions as the first high-time-frame gateway: a clean breach would confirm that the move out of the September trough has transitioned from corrective to impulsive character, validating the notion that June’s B-wave low has already printed.
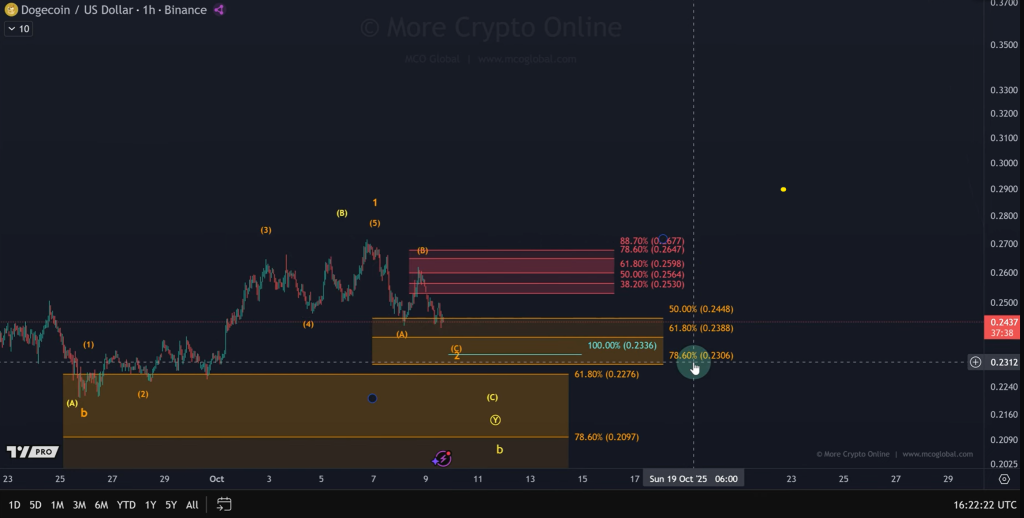
The lower-time-frame evidence is doing some heavy lifting. On the one-hour chart, price action out of the late-September base is described as a motive sequence: “The move to the upside from the September low appears to be a five-wave move up. This allows for the interpretation that we have already bottomed in the B-wave.” The decline from the September 13 local high is, in contrast, framed as a completed three-leg retracement.

If that count holds, the present pullback should remain corrective and terminate above clearly defined micro levels: “Upper micro support is between $0.23 and $0.245 with an additional key level… at $0.233,” the analyst notes. The condition is crisp: “Ideally we’re holding above $0.23 in this pullback. If we see an impulsive reaction from here to the upside, then this could be the beginning of a third-wave rally up.”
Risk management and location remain central. The broader support shelf that cushioned September’s local bottom sits above the daily invalidation line and is expected to remain active on any deeper shakeout: “This support area is still relevant… we might get another test… probably in the area around $0.21 to $0.20,” the analyst says, adding that this band nests within the larger $0.227–$0.20 zone. Lose $0.23 decisively and “it increases the probabilities that we are still caught in this B-wave,” he warns—a shift that would postpone, not nullify, the bullish roadmap so long as $0.189 endures.
What would carry Dogecoin beyond $0.49 toward the headline target of $0.60? The blueprint the analyst lays out implies an impulsive third-wave advance once micro support holds and September’s swing high gives way. In classical Elliott terms, a confirmed third wave often stretches beyond the initial motive leg, and the technician explicitly flags the setup: “If we see an impulsive reaction… this could be the beginning of a third-wave rally up.”
Moreover, the $0.49 handle—identified as the first destination after a breakout—would be a staging area rather than a terminus. After a fourth wave correction, DOGE could start a fifth wave which the analyst places in the $0.60 region.
The message, however, is emphatically conditional rather than euphoric. “It’s always important to zoom out,” the analyst reminds viewers, stressing that while Dogecoin is “moving up step by step slowly,” the advance is not yet an emphatic impulse.
At press time, DOGE traded at $0.25.

Featured image created with DALL.E, chart from TradingView.com


