


Reason to trust
![]()
Strict editorial policy that focuses on accuracy, relevance, and impartiality
Created by industry experts and meticulously reviewed
The highest standards in reporting and publishing
How Our News is Made
Strict editorial policy that focuses on accuracy, relevance, and impartiality
Ad discliamer
Morbi pretium leo et nisl aliquam mollis. Quisque arcu lorem, ultricies quis pellentesque nec, ullamcorper eu odio.
Ethereum has officially broken below the long-standing range it had maintained since early May, losing the critical $2,320 support level. This breakdown was triggered by escalating geopolitical tensions, as news broke that the United States had launched attacks on Iranian nuclear facilities. The announcement sent shockwaves through global markets, sparking widespread risk-off behavior and panic selling across crypto. Ethereum, already trading near the bottom of its six-week consolidation range, quickly reacted with a sharp drop, dragging the broader altcoin market with it.
The move marks a critical shift in sentiment, as Ethereum now trades outside the range that had served as a battleground between bulls and bears for over a month. With volatility spiking and confidence shaken, traders are re-evaluating risk in light of escalating conflict in the Middle East and broader macroeconomic headwinds.
According to top analyst Big Cheds, Ethereum’s weekly chart is now flirting with a potential tower top pattern completion — a bearish reversal structure that may signal further downside unless buyers reclaim key levels in the coming days. As the situation evolves, all eyes will remain on ETH’s ability to hold new support levels or risk further decline in a fragile market environment.
Ethereum Slides 22% From June Highs – All Eyes On Weekly Structure
Ethereum has lost over 22% of its value since peaking in early June, as global instability and heightened selling pressure weigh heavily on market sentiment. The asset has now broken below its six-week range, triggering concern among investors and adding to uncertainty across the broader crypto space. With rising tensions in the Middle East—particularly following US attacks on Iranian nuclear facilities—the market has entered a risk-off environment, dragging altcoins like Ethereum into deeper retracements.
Despite the volatility, Ethereum remains at the center of investor focus, as many still expect it to lead the next altseason. However, with bulls losing control of key support zones, confidence in a near-term rally continues to waver. Analysts are now split: while some predict a deeper retracement toward the $2,000 region, others argue that Ethereum is nearing exhaustion on the downside and may soon recover.
Big Cheds points to Ethereum’s weekly chart, where the price is currently flirting with a potential tower top pattern—a bearish reversal structure. If this pattern confirms, ETH may face another wave of downside before finding demand at lower supply levels.

If buyers step in during this pivotal moment, a recovery from this structure could quickly follow. The coming sessions will be critical in determining whether this breakdown extends or turns into a fakeout with bullish continuation. For now, traders should remain cautious, as Ethereum’s next move could define the tone of the altcoin market heading into July.
Ethereum Breaks Down Below Support As Volatility Spikes
Ethereum has officially broken below the $2,320 support level, signaling a shift in short-term market structure as shown in the 4-hour chart. After weeks of ranging between $2,320 and $2,650, ETH failed to reclaim its moving averages and lost bullish momentum. The price is now trading around $2,260, down sharply from its June highs near $2,900. This recent leg down follows a clean breakdown through the 50, 100, and 200-period SMAs, confirming a strong bearish momentum.
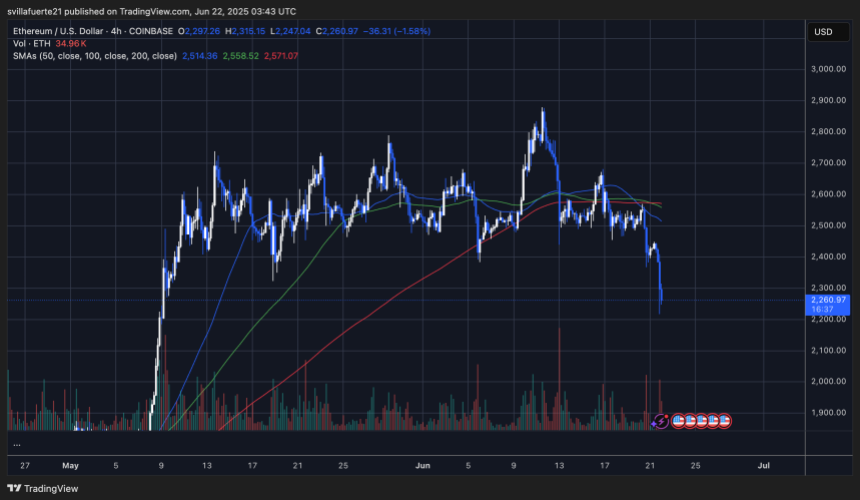
Volume spikes accompanied the drop, suggesting panic selling likely triggered by geopolitical turmoil in the Middle East. The price broke down aggressively with little resistance, meaning previous demand zones have now become weak. If buyers fail to step in quickly, Ethereum may revisit earlier May support levels around $2,100 or even $2,000.
From a technical standpoint, the breakdown invalidates the previous consolidation range, opening the door for a possible extended correction. Until ETH reclaims $2,320 and stabilizes above its moving averages, the risk of continued downside remains high. Market participants should watch closely for volume shifts or bullish divergences, but for now, Ethereum remains under pressure as uncertainty continues to dominate the macro environment. The next few sessions will be crucial for price discovery.
Featured image from Dall-E, chart from TradingView

Sebastian’s journey into the world of crypto began four years ago, driven by a fascination with the potential of blockchain technology to revolutionize financial systems. His initial exploration focused on understanding the intricacies of various crypto projects, particularly those focused on building innovative financial solutions. Through countless hours of research and learning, Sebastian developed a deep understanding of the underlying technologies, market dynamics, and potential applications of cryptocurrencies.
To share his insights with others, Sebastian became an active contributor to online discussions on platforms like X and LinkedIn. His focus on fintech and crypto-related topics quickly established him as a trusted voice in the online crypto community. Sebastian’s goal was to educate and inform his audience about the latest trends and insights in the rapidly evolving crypto landscape.
To further enhance his expertise, Sebastian pursued a UC Berkeley Fintech: Frameworks, Applications, and Strategies certification. This rigorous program equipped him with valuable skills and knowledge regarding Financial Technology, bridging the gap between traditional finance and decentralized finance. The certification deepened his understanding of the broader financial landscape and its intersection with blockchain technology.
Sebastian’s passion for finance and writing is evident in his work. He enjoys delving into financial research, analyzing market trends, and exploring the latest developments in the crypto space. In his spare time, Sebastian can often be found immersed in charts, studying 10-K reports, or engaging in thought-provoking discussions about the future of finance.
Sebastian’s journey as a crypto pioneer has been marked by a relentless pursuit of knowledge and a dedication to sharing his insights. His ability to navigate the complex world of crypto, combined with his passion for financial research and communication, makes him a valuable contributor to the industry. As the crypto landscape continues to evolve, Sebastian remains at the forefront, providing valuable insights and helping to shape the future of this revolutionary technology.
Disclaimer: The information found on NewsBTC is for educational purposes only. It does not represent the opinions of NewsBTC on whether to buy, sell or hold any investments and naturally investing carries risks. You are advised to conduct your own research before making any investment decisions. Use information provided on this website entirely at your own risk.


