


Reason to trust
![]()
Strict editorial policy that focuses on accuracy, relevance, and impartiality
Created by industry experts and meticulously reviewed
The highest standards in reporting and publishing
How Our News is Made
Strict editorial policy that focuses on accuracy, relevance, and impartiality
Ad discliamer
Morbi pretium leo et nisl aliquam mollis. Quisque arcu lorem, ultricies quis pellentesque nec, ullamcorper eu odio.
As Litecoin (LTC) tries to break out of a bullish pattern, an analyst suggests that a monthly close above its key horizontal zone could propel the price to levels not seen since the 2021 bull run.
Litecoin Attempting Key Breakout
Litecoin has seen a remarkable 63% rally from April’s lows over the past month and a half, surging above crucial levels in the past few weeks. Just this month, the cryptocurrency has recovered the $80 and $90 support levels and attempted to reclaim the $100 barrier again.
Fueled by the market recovery and Bitcoin’s rally past the $100,000 mark, LTC hit a two-month high of $107 nearly two weeks ago. Since then, the altcoin has struggled to hold the $100 mark.
However, analyst Carl Runefelt from The Moon Show recently suggested that Litecoin “is about to pump.” The analyst highlighted a bullish pattern on LTC’s chart, which could see the cryptocurrency rise 20% toward the $117.5 mark for the first time since early March.
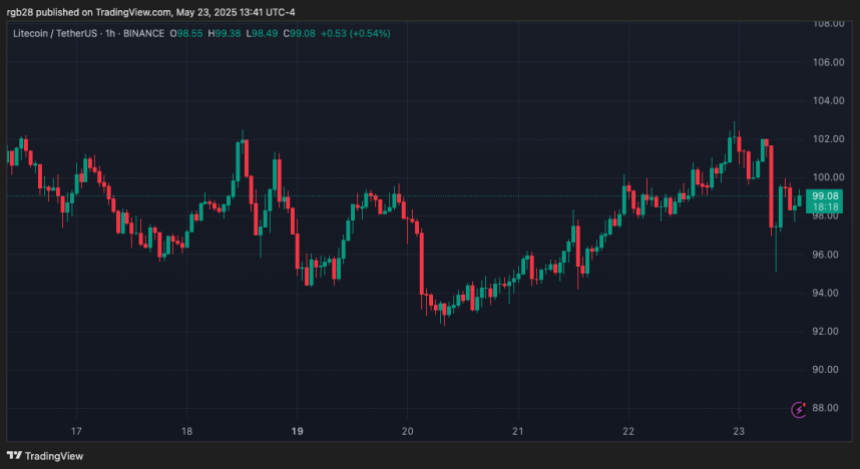
According to Runefelt’s chart, the cryptocurrency formed a bullish flag pattern after hitting its two-month high. Since then, LTC has hovered between the upper and lower boundary, bouncing once before from the support line toward the pattern’s resistance line.
Earlier this week, Litecoin bounced again from the support after touching the $92 level, which led the analyst to suggest it has “every chance to break out of this bullish flag to the upside.”
On Friday, the altcoin jumped 11% from the pattern lows, briefly breaking out and hitting the $102 mark before retracing to the $96 mark. The cryptocurrency now hovers between the $98-$99 levels, just 1% below the pattern’s upper boundary.
A surge above this level to confirm the breakout could set the stage for the pattern’s $117.5 target and mark a significant push toward a key horizontal level.
LTC Preparing For Rally To $150?
Analyst Rekt Capital pointed out that Litecoin needs a Monthly Close above its key resistance level to target the $150 mark and above. He highlighted the $110-$125 horizontal level, explaining that LTC “spends most of its time below it and very little time comparatively beyond it.”
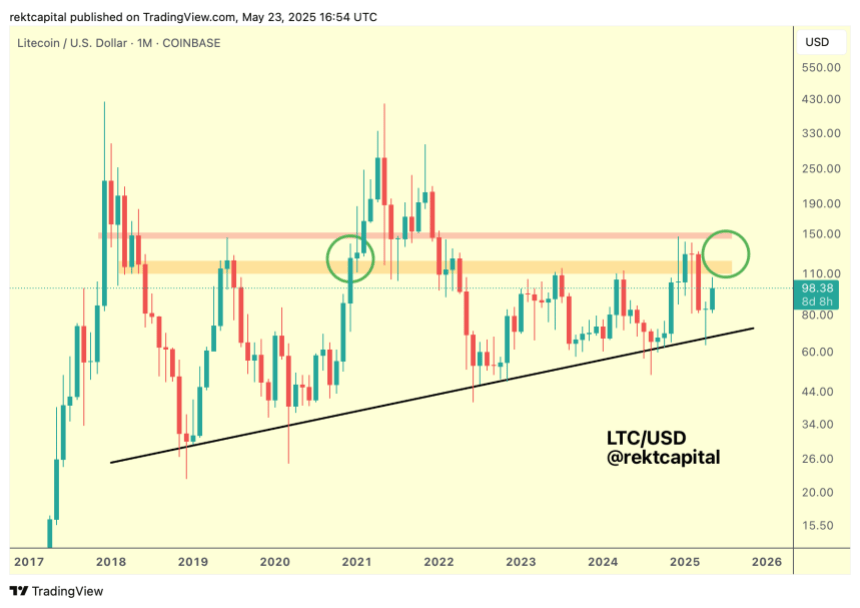
The analyst noted that since 2019, the rejection from this resistance level has been getting “progressively weaker over time to the point where only a couple of months ago, LTC tried to retest this region as support” during the early 2025 rally.
Despite failing to reclaim this level, this could suggest that the resistance is “struggling to hold price down,” which is why the next breakout above this area could signal that “the chances of a successful retest are high.”
Moreover, the weakening of the resistance could be partly attributed to its multi-year Marco Higher Low, as Litecoin has bounced from the ascending trendline toward this resistance each time it has been retested.
Based on this, the analyst considers that a Monthly Close above the key horizontal level, followed by a retest to confirm the breakout, would give the necessary strength for a 30% rally above the $150 mark for the first time since 2021.
As of this writing, Litecoin trades at $98.60, a 2.7% decline in the weekly timeframe.
Featured Image from Unsplash.com, Chart from TradingView.com

Rubmar is a writer and translator who has been a crypto enthusiast for the past four years. Her goal as a writer is to create informative, complete, and easily understandable pieces accessible to those entering the crypto space. After learning about cryptocurrencies in 2019, Rubmar became curious about the world of possibilities the industry offered, quickly learning that financial freedom was at the palm of her hand with the developing technology.
From a young age, Rubmar was curious about how languages work, finding special interest in wordplay and the peculiarities of dialects. Her curiosity grew as she became an avid reader in her teenage years. She explored freedom and new words through her favorite books, which shaped her view of the world. Rubmar acquired the necessary skills for in-depth research and analytical thinking at university, where she studied Literature and Linguistics. Her studies have given her a sharp perspective on several topics and allowed her to turn every stone in her investigations.
In 2019, she first dipped her toes in the crypto industry when a friend introduced her to Bitcoin and cryptocurrencies, but it wasn’t until 2020 that she started to dive into the depth of the industry. As Rubmar began to understand the mechanics of the crypto sphere, she saw a new world yet to be explored.
At the beginning of her crypto voyage, she discovered a new system that allowed her to have control over her finances. As a young adult of the 21st century, Rubmar has faced the challenges of the traditional banking system and the restrictions of fiat money.
After the failure of her home country’s economy, the limitations of traditional finances became clear. The bureaucratic, outdated structure made her feel hopeless and powerless amid an aggressive and distorted system created by hyperinflation. However, learning about decentralization and self-custody opened a realm of opportunities. Cryptocurrencies allowed her to experience financial control for the first time and expand her financial education.
Moreover, the peculiar nature of the crypto community sparked Rubmar’s curiosity about the other layers of the industry. As a result, she found a particular interest in discovering the diverse perspectives of investors, market watchers, experts, and developers. Her attempts to better understand the crypto space made her realize the strong links of the community with other industries, enriching her perspective of the sector. As someone who spends most of her day online, Rubmar enjoys finding the points where the crypto world meets with her other passions and hobbies –or her favorite memes.
In her free time, she usually finds joy in different art forms. As a child, she enlisted in every extra-curricular activity in her hometown, including music classes, dancing, jewelry making, and the local chorus. Despite her many attempts to learn different instruments, Rubmar only knows how to play the xylophone, which she played for 7 years in her school’s marching band.
She also has a passion for learning new languages and cultures, having set the goal to learn another six languages – currently attempting to learn Italian and Korean. Scrapbooking, paper crafting, and bookbinding are her biggest interests outside of work, constantly taking classes and attending workshops to learn new techniques. The rest of her free time is spent stressing over football matches and transfer market news or feeding cats –hers or stray.
In summary, Rubmar seeks to present entertaining and educational pieces to be enjoyed by everybody, aiming to report on the latest news and offer a unique perspective while adding a meme or a pun whenever possible.
Disclaimer: The information found on NewsBTC is for educational purposes only. It does not represent the opinions of NewsBTC on whether to buy, sell or hold any investments and naturally investing carries risks. You are advised to conduct your own research before making any investment decisions. Use information provided on this website entirely at your own risk.


