


Shiba Inu price has formed a highly bullish harmonic pattern, pointing to an eventual 190% surge as the burn rate soars.
Shiba Inu (SHIB) coin rose to $0.000016 on Sunday, its highest level since February this year, and 52% above the lowest level this year.
The token jumped as Ethereum (ETH) hugged the important resistance level at $2,500 for the first time since February. This surge triggered more upside for popular ERC tokens like Pepe (PEPE), AAVE (AAVE), and Uniswap (UNI).
Shiba Inu price also jumped after the burn rate surged by 234,584% on Sunday, with over 19 million tokens being incinerated. One user sent over 17.8 million tokens to a burn address, while another one burned 1 million tokens.
In theory, a token burn help to boost a coin price because it reduces the supply. Data shows that Shiba Inu has burned over 410 trillion tokens since its creation, with most of these coming from Vitalik Buterin.
Shiba Inu price has also done well because of the growing Shibarium network. Its layer-2 network handled over 3.76 million transactions in the last 24 hours, bringing the cumulative total to 1.152 billion. Its total addresses have jumped to over 207 million.
More data shows that the total value locked in the Shibarium network has jumped to $3.84 million, its highest level since January 21. This is a big increase since the network had a TVL of $2.15 million earlier this year. Most of this growth has come from ShibaSwap and WoofSwap.
Shiba Inu price analysis
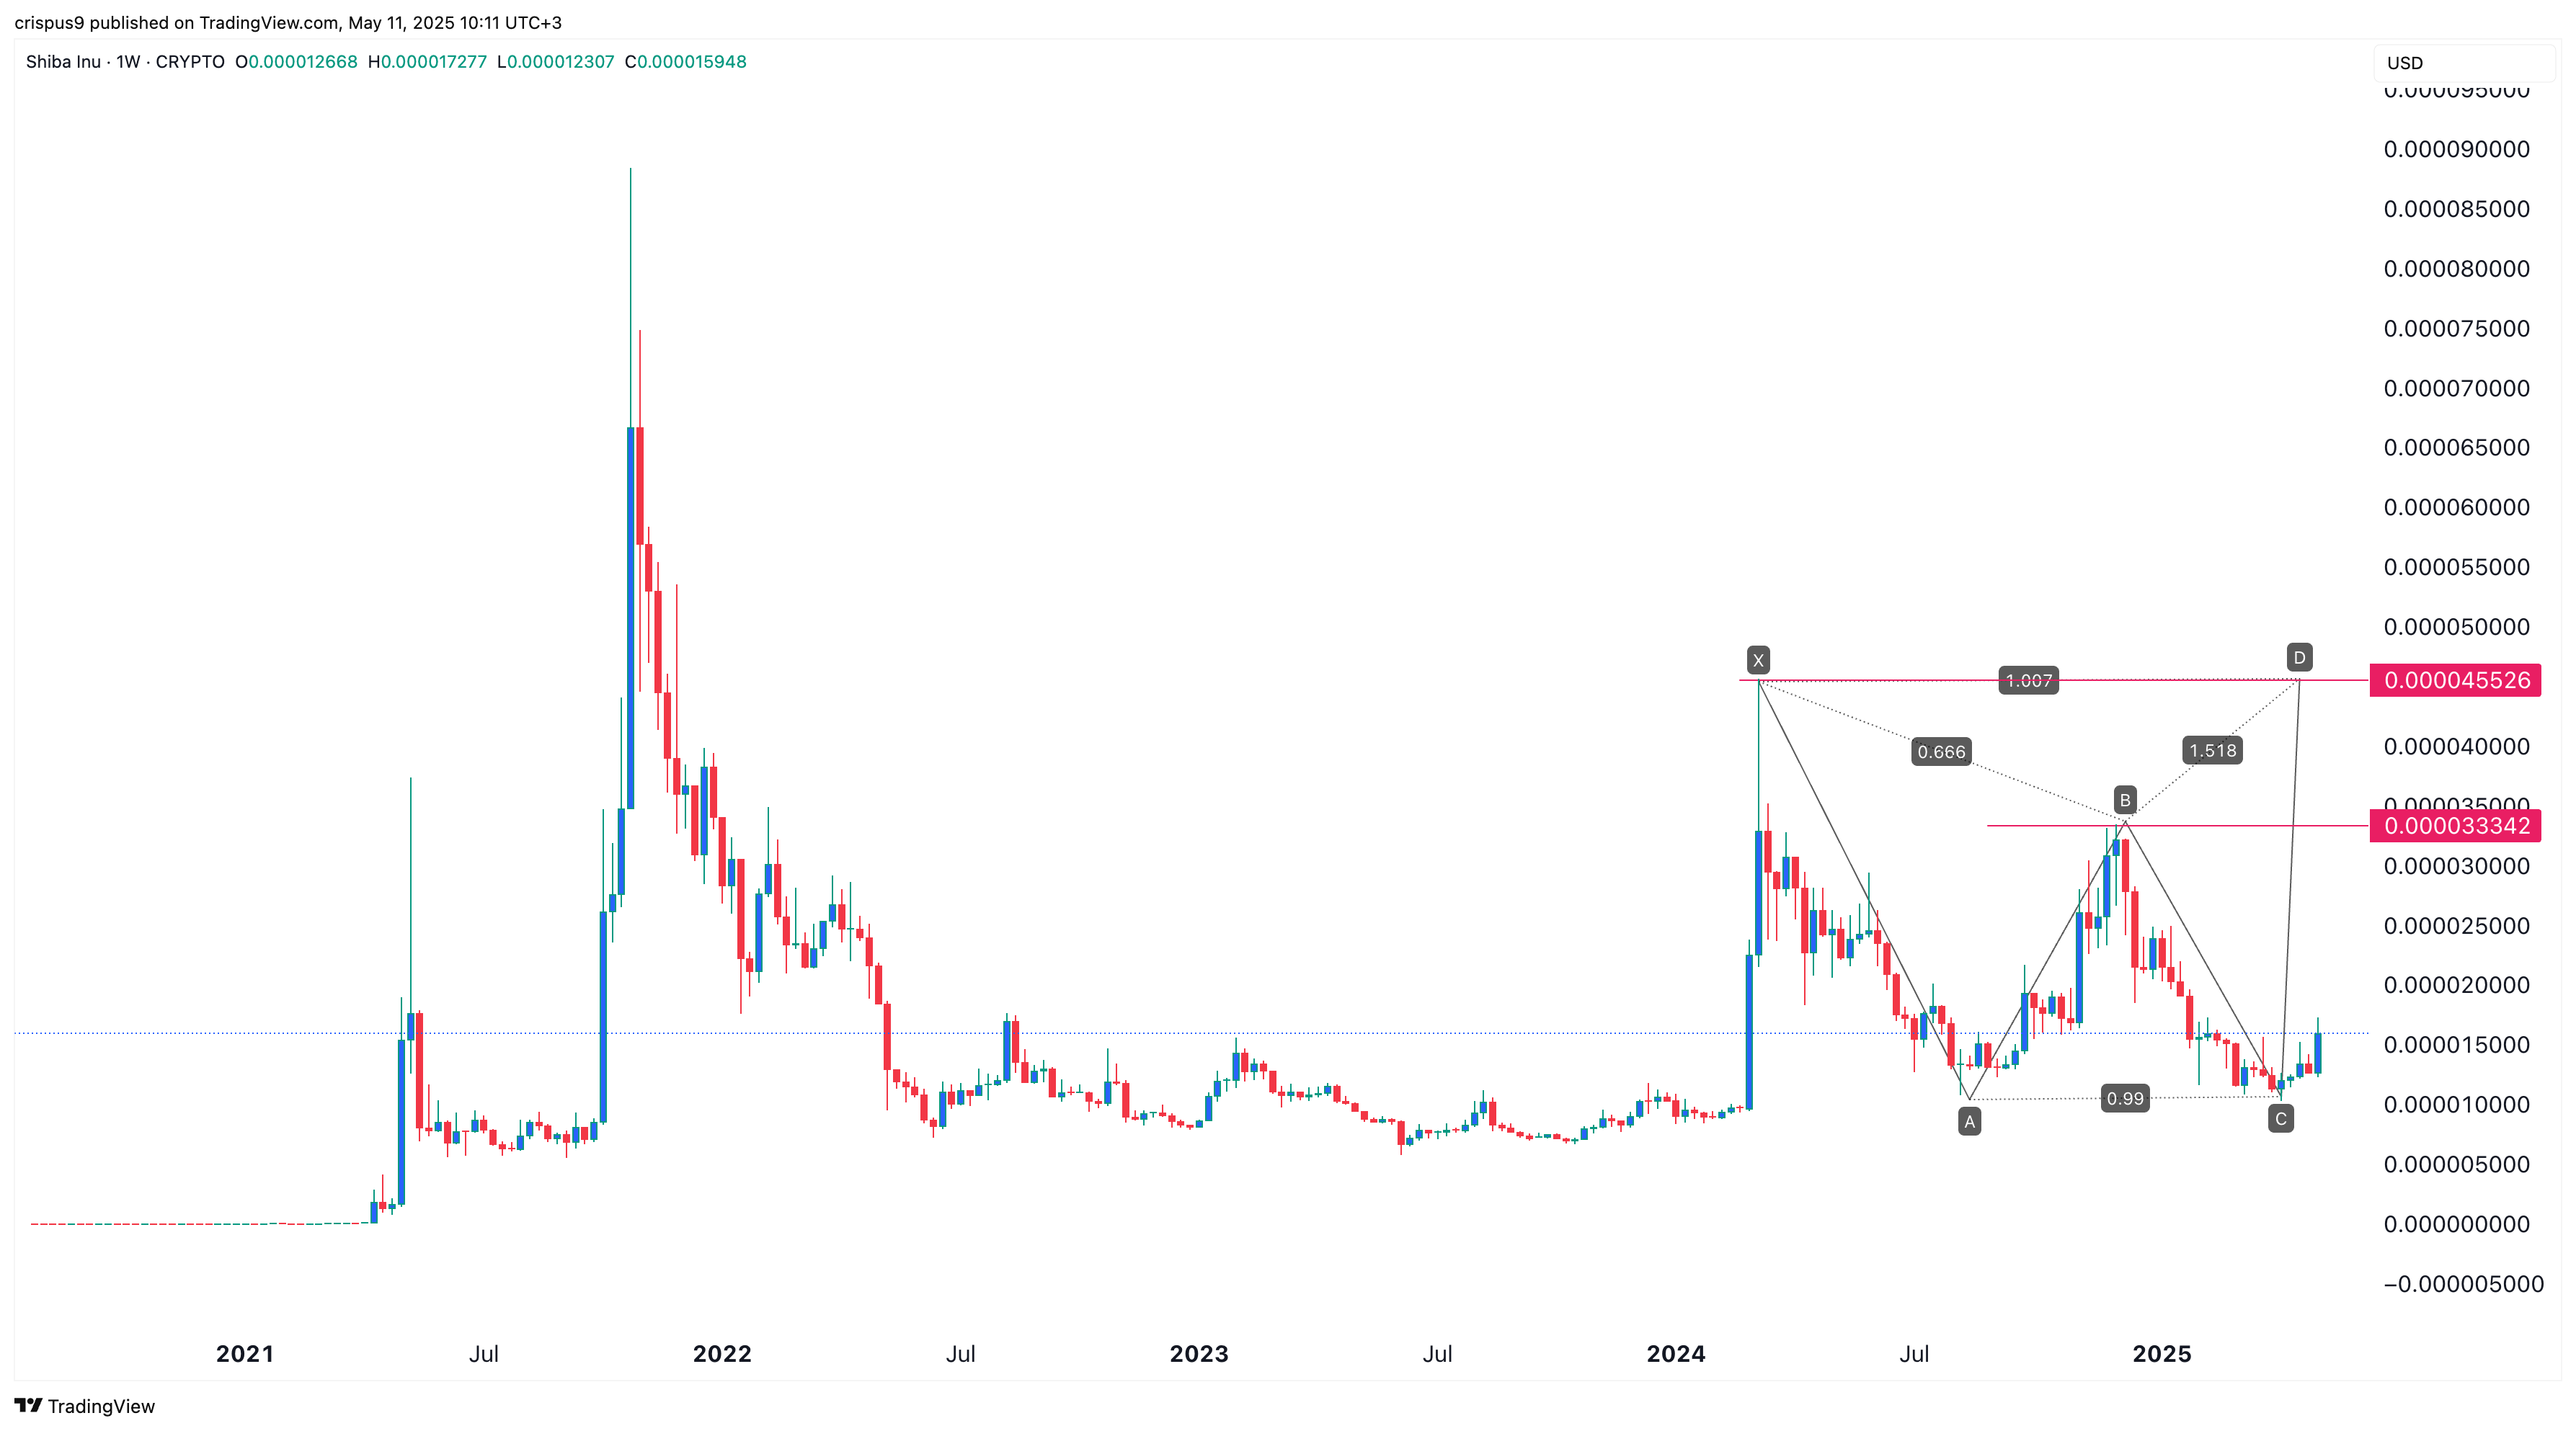
The weekly chart shows that the Shiba Inu price has formed a popular harmonic chart pattern. The XA section happened between its highest point in 2024 and its lowest point in August.
It then formed the AB section through December, and the BC section through April this year. It has now embarked on the CD section that may push it back to its 2024 high of $0.0000455, which is about 190% above the current level.
Notably, the AC section of this pattern is at $0.000033, which is its double bottom. Therefore, if it surges above the neckline at $0.000033, the path to its 2024 high will be confirmed.


