


Reason to trust
![]()
Strict editorial policy that focuses on accuracy, relevance, and impartiality
Created by industry experts and meticulously reviewed
The highest standards in reporting and publishing
How Our News is Made
Strict editorial policy that focuses on accuracy, relevance, and impartiality
Ad discliamer
Morbi pretium leo et nisl aliquam mollis. Quisque arcu lorem, ultricies quis pellentesque nec, ullamcorper eu odio.
As uncertainty in the broader market looms over the crypto space, some market pundits remain remarkably upbeat—especially when it comes to XRP.
A anonymous cryptocurrency analyst referred to as “Papa” sees XRP reaching a price of up to $14 despite the latest challenges besetting the digital money. The bold prediction comes amid XRP fighting to hold steady at the level of around $2 after experiencing four straight days of losses.
Market Sends Uncertain Signals On XRP Future
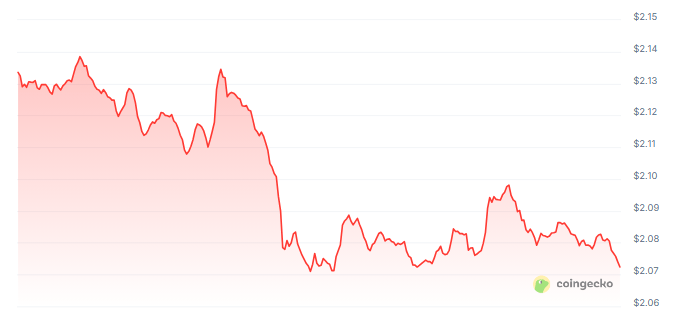
XRP last reached a two-week high of $2.24 on April 13 before pressure from selling took it down to $2.04 by Friday, April 18.
This 4% decline was the first instance since late March when XRP had recorded four consecutive days of falling prices. As per current technical markers, sentiment remains neutral while the Fear & Greed Index hovers at 39, solidly in “Fear” territory.
$XRP SCREAMING HIGHER 🚀 pic.twitter.com/DnRGTDs5x6
— PAPA♛ (@MamaGucci) April 19, 2025
In spite of these warning signs, Papa is convinced XRP is “screaming higher” according to chart patterns that reflect the cryptocurrency’s historic bull run of 2017-2018.
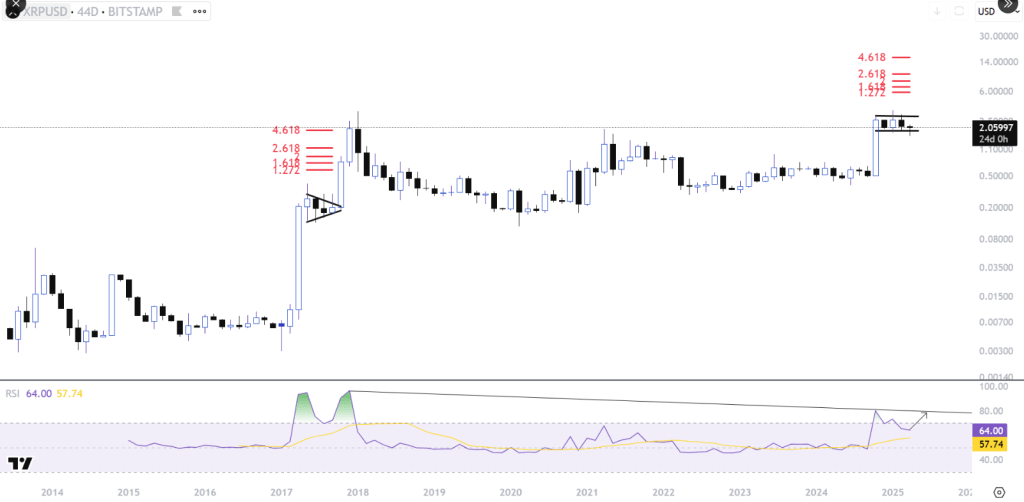
History May Repeat With New Chart Patterns
Reflecting on XRP’s most explosive growth phase, the analyst identifies a symmetrical triangle pattern that developed on a 44-day chart in the 2017-2018 bull market.
Following an initial 7,800% rise from $0.0055 in March 2017 to $0.3988 in May of that year, XRP consolidated before breaking out to hit its then-all-time high of $3.31 in January 2018—a breathtaking 1,760% rise from its low of $0.177.
Based on these figures, Papa observes similar trends emerging in the current market. In the present cycle, XRP rose 570% from November 2024 at $0.50 to an all-time high of $3.39 in January 2025. Since then, it has fallen 38% and spent three months consolidating.
Technical Indicators Hint At Double-Digit Prices
The analyst’s price targets are derived from Fibonacci extension levels—technical indicators that traders use to forecast price action. During its 2017-2018 run, XRP hit multiple Fibonacci targets at the 1.272, 1.618, 2.618, and 4.618 levels.
Featured image from CoinFlip, chart from TradingView

They say journalists never truly clock out. But for Christian, that’s not just a metaphor, it’s a lifestyle. By day, he navigates the ever-shifting tides of the cryptocurrency market, wielding words like a seasoned editor and crafting articles that decipher the jargon for the masses. When the PC goes on hibernate mode, however, his pursuits take a more mechanical (and sometimes philosophical) turn.
Christian’s journey with the written word began long before the age of Bitcoin. In the hallowed halls of academia, he honed his craft as a feature writer for his college paper. This early love for storytelling paved the way for a successful stint as an editor at a data engineering firm, where his first-month essay win funded a months-long supply of doggie and kitty treats – a testament to his dedication to his furry companions (more on that later).
Christian then roamed the world of journalism, working at newspapers in Canada and even South Korea. He finally settled down at a local news giant in his hometown in the Philippines for a decade, becoming a total news junkie. But then, something new caught his eye: cryptocurrency. It was like a treasure hunt mixed with storytelling – right up his alley!
So, he landed a killer gig at NewsBTC, where he’s one of the go-to guys for all things crypto. He breaks down this confusing stuff into bite-sized pieces, making it easy for anyone to understand (he salutes his management team for teaching him this skill).
Think Christian’s all work and no play? Not a chance! When he’s not at his computer, you’ll find him indulging his passion for motorbikes. A true gearhead, Christian loves tinkering with his bike and savoring the joy of the open road on his 320-cc Yamaha R3. Once a speed demon who hit 120mph (a feat he vowed never to repeat), he now prefers leisurely rides along the coast, enjoying the wind in his thinning hair.
Speaking of chill, Christian’s got a crew of furry friends waiting for him at home. Two cats and a dog. He swears cats are way smarter than dogs (sorry, Grizzly), but he adores them all anyway. Apparently, watching his pets just chillin’ helps him analyze and write meticulously formatted articles even better.
Here’s the thing about this guy: He works a lot, but he keeps himself fueled by enough coffee to make it through the day – and some seriously delicious (Filipino) food. He says a delectable meal is the secret ingredient to a killer article. And after a long day of crypto crusading, he unwinds with some rum (mixed with milk) while watching slapstick movies.
Looking ahead, Christian sees a bright future with NewsBTC. He says he sees himself privileged to be part of an awesome organization, sharing his expertise and passion with a community he values, and fellow editors – and bosses – he deeply respects.
So, the next time you tread into the world of cryptocurrency, remember the man behind the words – the crypto crusader, the grease monkey, and the feline philosopher, all rolled into one.
Disclaimer: The information found on NewsBTC is for educational purposes only. It does not represent the opinions of NewsBTC on whether to buy, sell or hold any investments and naturally investing carries risks. You are advised to conduct your own research before making any investment decisions. Use information provided on this website entirely at your own risk.


