


Aster price is tightening into a Bollinger squeeze after the team executed an $80 million token burn and pushed its Stage 4 buyback live.
Summary
- Aster fell to $1.03 as volume declined sharply and derivatives activity cooled across the board.
- The team completed an $80M token burn and accelerated S4 buybacks, aiming to reduce supply and stabilize conditions.
- The chart shows a clear volatility squeeze, drifting toward support as momentum indicators weaken.
Aster was trading at $1.03 at press time, down 2.7% in the last 24 hours. The token has moved between $0.9007 and $1.12 over the past week, leaving it 5% lower on the seven-day window and still 57% below its September all-time high of $2.41.
Spot trading activity has cooled noticeably. Daily volume slipped 18.5% to $274.3 million, showing that participation has thinned as the market drifts into a tight consolidation phase.
Derivatives metrics reflect the same mood. Futures volume fell 19.27% to $805.5 million, and open interest dipped 3.4% to $476.7 million. This usually indicates a market that is stepping back from aggressive positioning.
Aster (ASTER) fundamentals are again in the spotlight after the team confirmed a major supply cut on Dec. 5. According to an announcement on X, Aster executed the burn tied to its S3 buyback program, permanently removing 77.86 million ASTER tokens from circulation. The tokens are valued at around $80 million at current prices.
Another 77.86 million were locked for future airdrops. The team says the goal is to improve long-term scarcity and strengthen the token’s supply profile as more buybacks continue.
[Important Notice] Buyback Token Burn Executed 🔥
Following the completion of our S3 buyback program (155,720,656 $ASTER tokens), we have executed the token burn and airdrop allocation as committed.
Execution Details (December 5, 2025, 00:00 UTC):
🔥 77,860,328 $ASTER tokens… pic.twitter.com/OHkLzEag24
— Aster (@Aster_DEX) December 5, 2025
Earlier on Dec. 2, Aster revealed that it had activated its Stage 4 buyback eight days ahead of schedule to support holders during unstable market conditions. The mechanism is funded by protocol fees and, during periods of heavy activity, has previously absorbed more than $2 million per day from the open market.
If the pattern repeats, sustained burns could help steady prices by reducing circulating supply and reinforcing liquidity incentives.
Aster price technical analysis
Aster is showing early signs of a Bollinger Band squeeze. The bands have pulled in tightly on the right side of the chart, which usually means volatility is drying up and a bigger move could be coming.
Throughout the recent decline, the price has been consistently rejected at the mid-band, the 20-period moving average, which has served as a dynamic ceiling.
Several earlier touches on the upper band failed to gain traction, confirming a steady loss of bullish momentum.
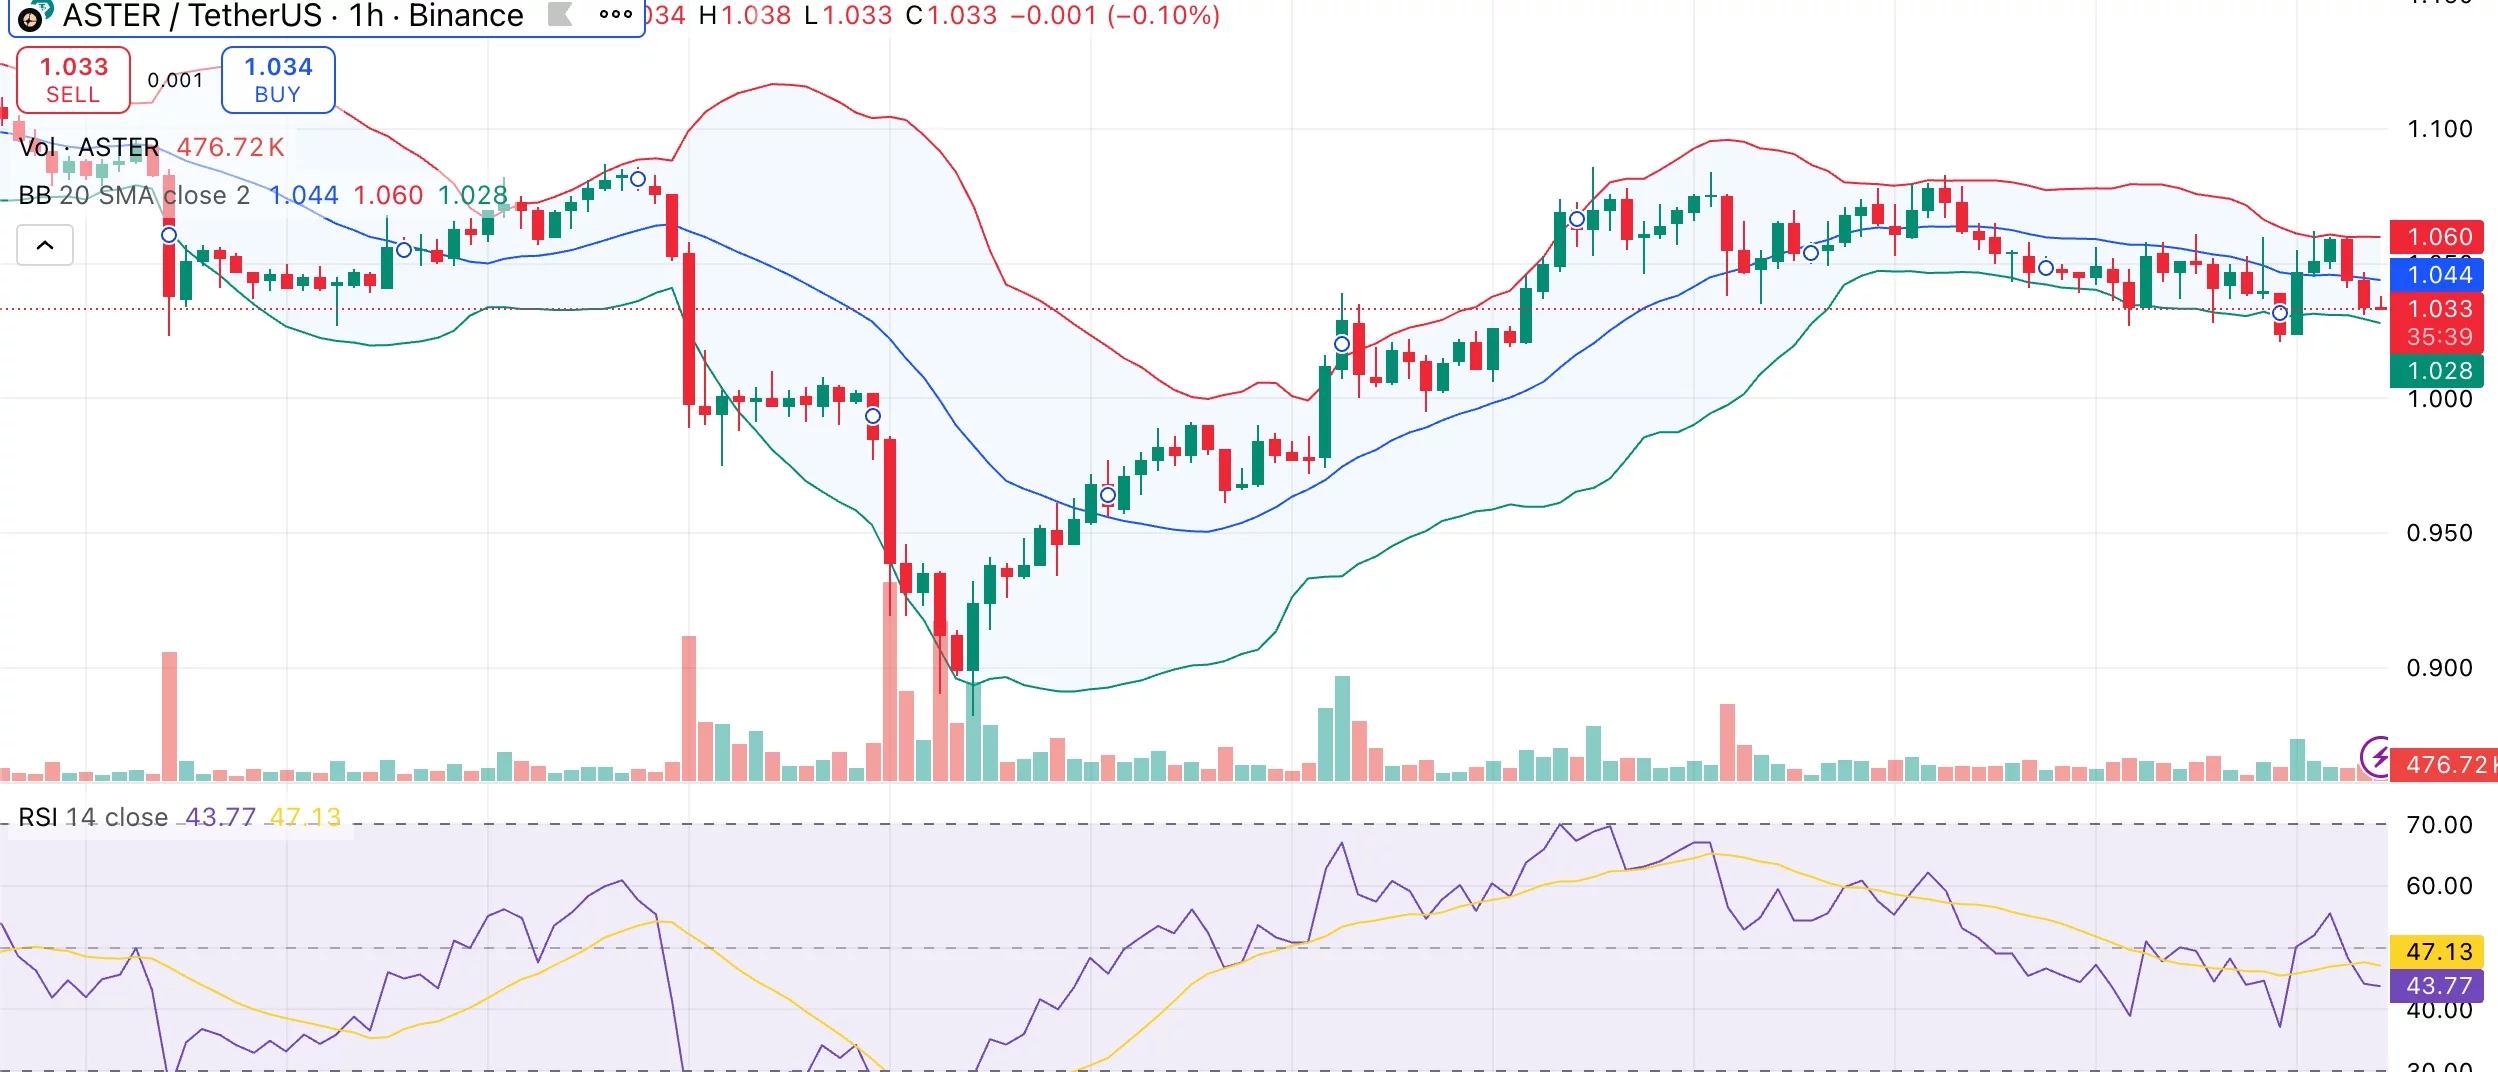
The structure itself has a slight negative tilt. Over the previous sessions, candles have hovered nearer to the lower band, indicating increasing downside pressure, while lower highs have formed. Momentum indicators also show the same slowdown.
After a few declining sessions, the relative strength index has eased into the mid-40s, indicating waning strength without going into oversold territory. Attempts to rebound have stalled below the mid-50s, which typically shows sellers still have an edge. MACD is negative, adding to the picture of fading bullish energy.
If buyers reclaim the mid-band and push through $1.06 with expanding volume, the chart could open room toward $1.09 and $1.12. A clean drop below the $1.03 shelf would break the squeeze to the downside and expose $0.98 and the wider $0.94 area as the next supports.


