

Solana price has been in a downtrend since mid-September, as network activity has continued to slow during the period.
Summary
- Solana price is down over 50% from its September high.
- Solana’s TVL and stablecoin supply have declined over the past few months.
- A giant rounded top pattern has formed on the daily chart.
Solana (SOL) has dropped 45% from its September high of $252.78 and is down 52.4% from its all-time high. Trading at $139.75 at press time, the sixth-largest crypto asset stood at a market cap of $77.4 billion. Its daily trading volume was down 20% over the past 24 hours at $6.85 billion.
The altcoin fell as a broader investor sell-off hit the crypto market in September, a period often referred to as “Red September,” which affected many altcoins significantly. Concerns about inflation, shifting interest rate expectations, and global economic uncertainty arising from U.S. President Donald Trump’s proposed tariffs on major economies have also dampened investor appetite for riskier assets such as cryptocurrencies.
Looking particularly at Solana’s on-chain data, it shows that the total value locked across DeFi-based protocols on the Solana blockchain has dropped to $25.8 billion from $35.4 billion seen around mid-September. The total supply of stablecoins on the network has also shrunk nearly 20% from its year-to-date high reached in October to around $13 billion at press time.
Declining TVL and shrinking stablecoin reserves on the network suggest that capital is steadily flowing out of the Solana ecosystem. As such, investors could likely withdraw their liquidity or reduce their exposure if risk sentiment continues to deteriorate.
Even the recent launch of multiple U.S. spot Solana ETFs from asset managers like Bitwise, Grayscale, VanEck, and Fidelity has not managed to immediately provide any meaningful upward pressure on the price, despite accumulating nearly $420 million in inflows since launch.
Solana price analysis
On the daily chart, Solana price has formed a giant bearish rounded top pattern that begins to take shape when the price gradually peaks over time and creates a dome-like structure (See below.) This pattern is typically a precursor to deeper losses as momentum fades and buyers lose strength.
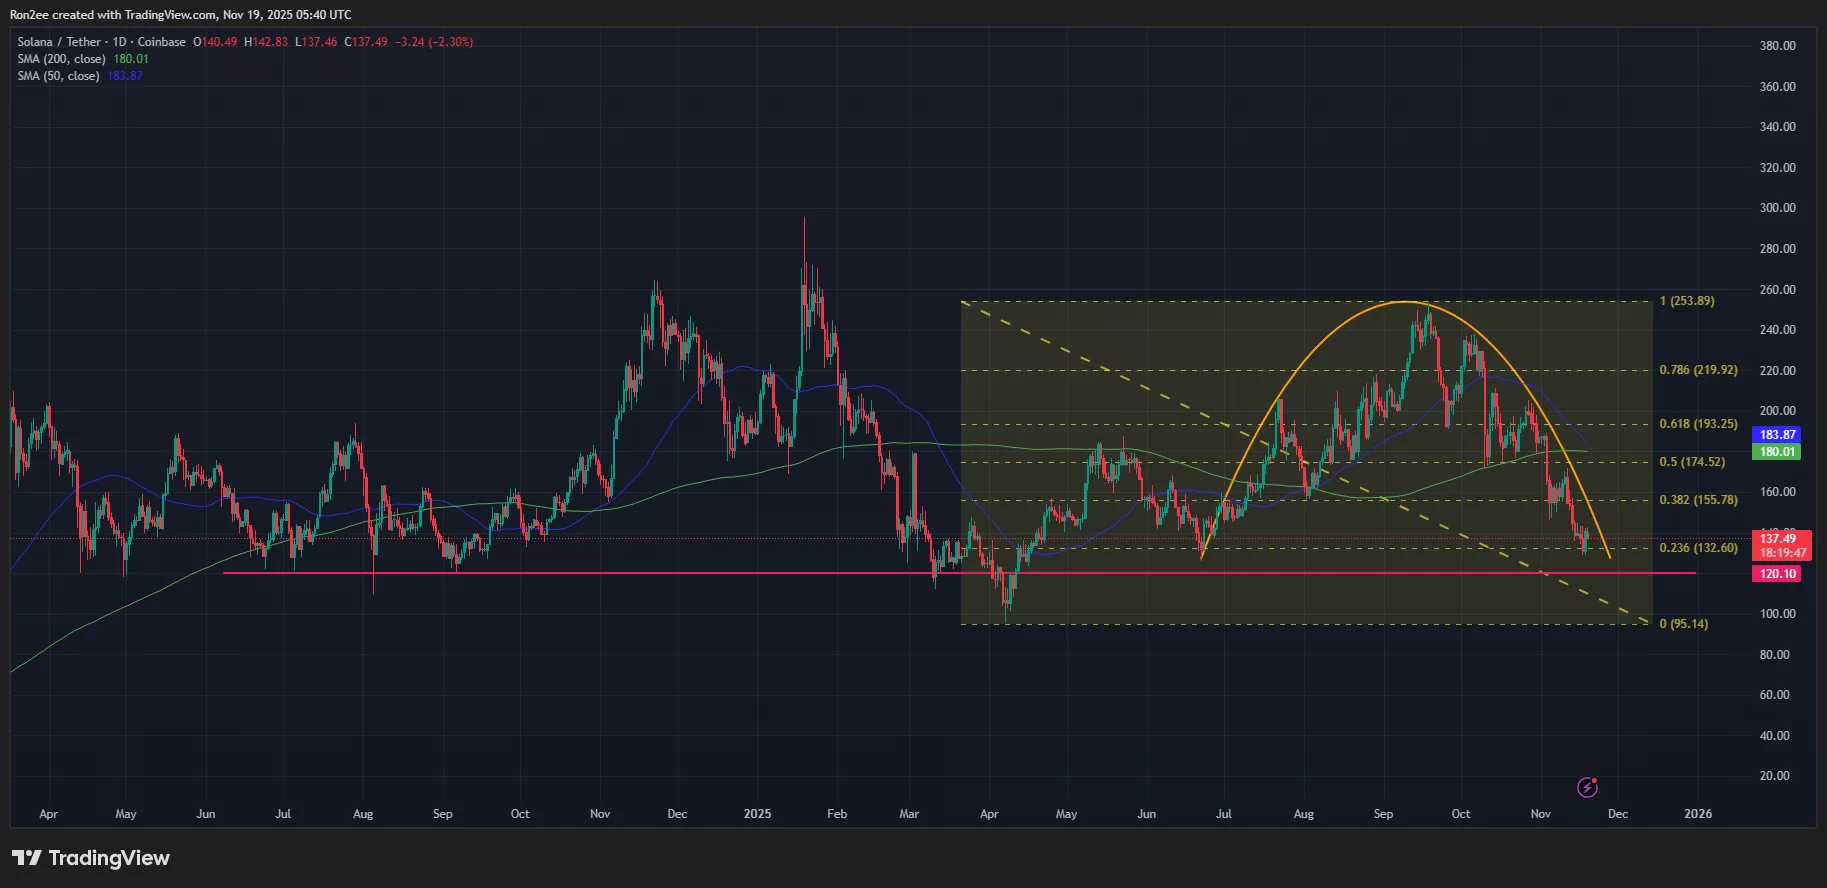
More importantly, a death cross also appears to be looming as the 50-day Simple Moving Average approaches a crossover with the 200-day one. While a death cross is a lagging indicator, in the context of Solana’s recent price action and the bearish rounded top pattern, it presents a very bearish scenario for the token.
As such, Solana price may be at risk of dropping to $120, a key support level where buyers have often stepped in during previous downturns. In the event it loses this level, a drop to $95 will become increasingly likely, matching price levels last seen earlier in April this year.
Disclosure: This article does not represent investment advice. The content and materials featured on this page are for educational purposes only.


