


Bitcoin ETFs are still holding strong, continuing their trend of inflows despite the recent dip in the asset’s price.
Summary
- Bitcoin price has dipped to $122,200, retreating from a $126,198 high amid fresh selling pressure.
- U.S.-listed Bitcoin ETFs are still recording inflows, pulling a total of $875.6 million on Oct. 7.
- Despite the pullback in price, BTC remains bullish, with support at $120,000 and RSI cooling to 63.35 after nearing overbought levels.
Bitcoin ETFs have posted another day of inflows, recording a total of $876.5 million during the latest trading session on October 7. This marks the seventh consecutive day of gains for the funds, adding to the $4.43 billion attracted over the past six days amid Bitcoin’s recent rally.
Data from SoSoValue shows that BlackRock’s IBIT made up the lion’s share with $899.4 million, followed by Valkyrie’s BRRR with a far more modest $4.8 million. Grayscale’s GBTC offset the positive figures with roughly $28.6 million in outflows, marking the only fund with withdrawals.
Meanwhile, the rest of the eight funds, including Fidelity, Invesco, and Bitwise, posted no net activity. The latest performance suggests that profit-taking is already picking up among institutional investors, along with broader cooling as the asset’s price retreats from the month’s peak.
Bitcoin price drops on daily chart
At the time of writing, the flagship cryptocurrency trades at $122,392, down 1.5% over the past 24 hours, per crypto.news data. The decline follows a near two-week rally that began from the $108,000 region. Today’s bearish candle reflects hesitation around the $124,000 resistance level, where BTC (BTC) faced rejection before sliding lower.
Despite the retreat, indicators suggest the correction is healthy. The RSI, which recently peaked above 70, has now cooled to 63.35, showing that momentum is resetting. Volume has also declined, indicating the sell-off lacks strong conviction.
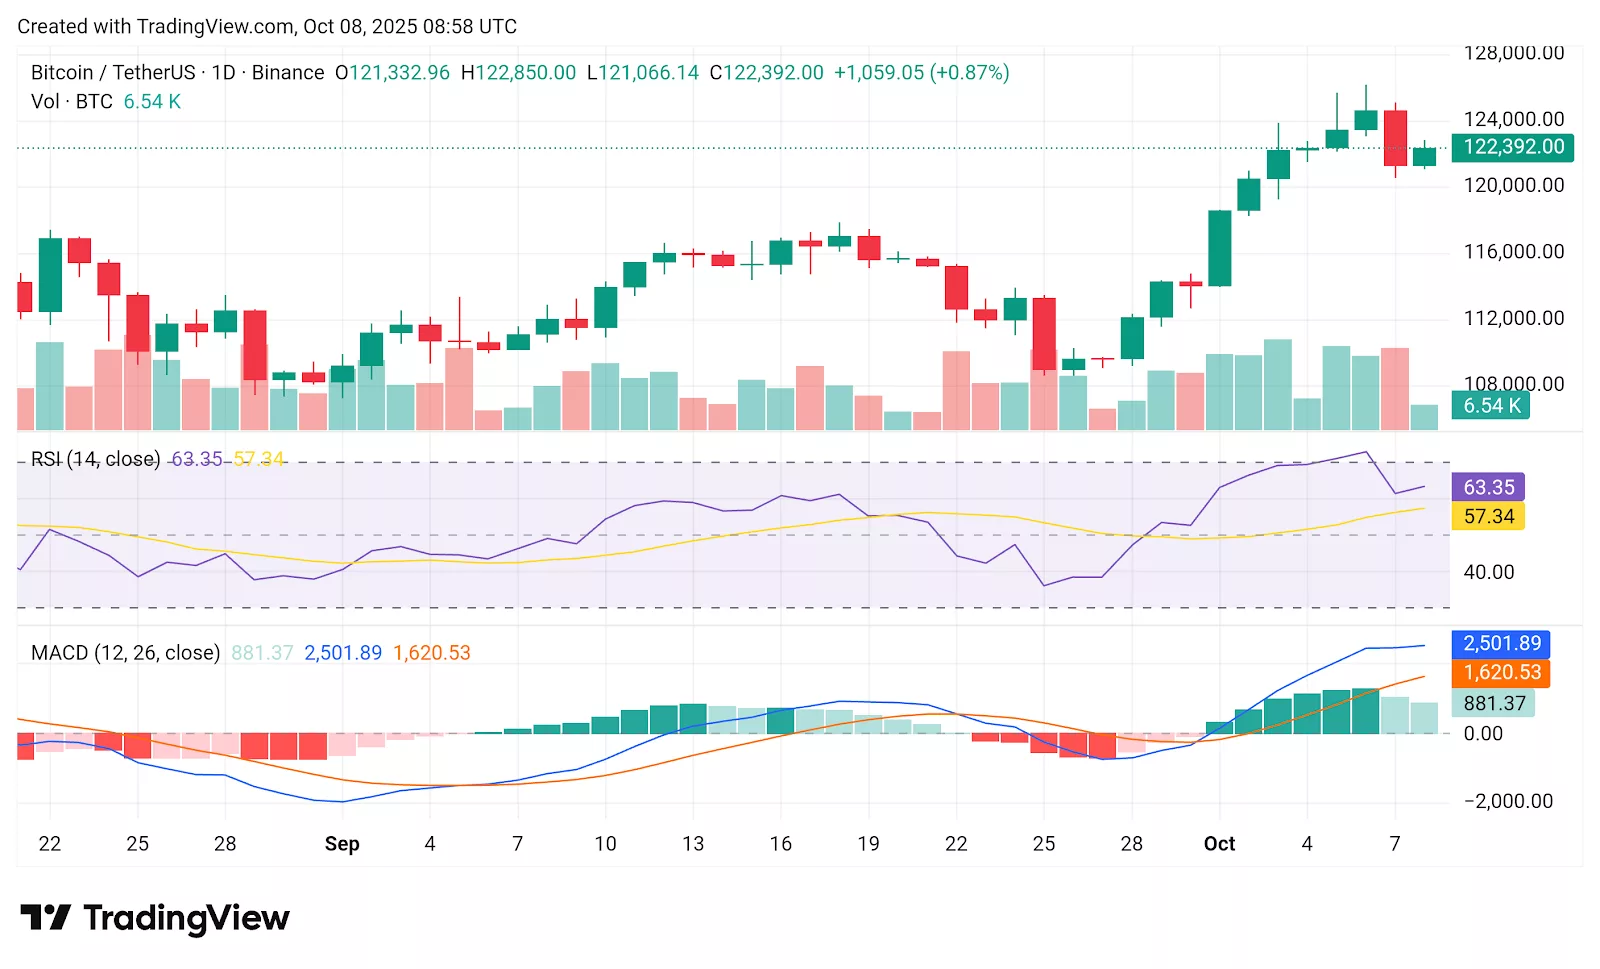
Meanwhile, the MACD remains in bullish territory, with the histogram still widening and the MACD line comfortably above the signal line. So long as Bitcoin holds above $120,000, the broader structure stays bullish, and the market may simply be consolidating before another move up.
However, if the price breaks below $119,500, a deeper pullback toward $116,000–$117,000 could unfold, which served as a base during the last consolidation. On the upside, reclaiming $124,000 could reignite bullish momentum toward $126,000–$128,000.


