


Solana price could be on the brink of a breakout as it has flipped a key resistance level into support, backed by renewed demand from institutional investors.
Summary
- Solana price has flipped a historic resistance level into support.
- Smart money investors have begun accumulating the token.
- A multi-year cup and handle pattern has formed on the weekly chart.
According to data from crypto.news, Solana (SOL) was trading at $212.39 at press time, up 10.6% from its September low and over 100% from its year-to-date low.
The token has displayed multiple bullish signs that suggest it could be gearing up for strong gains over the coming weeks.
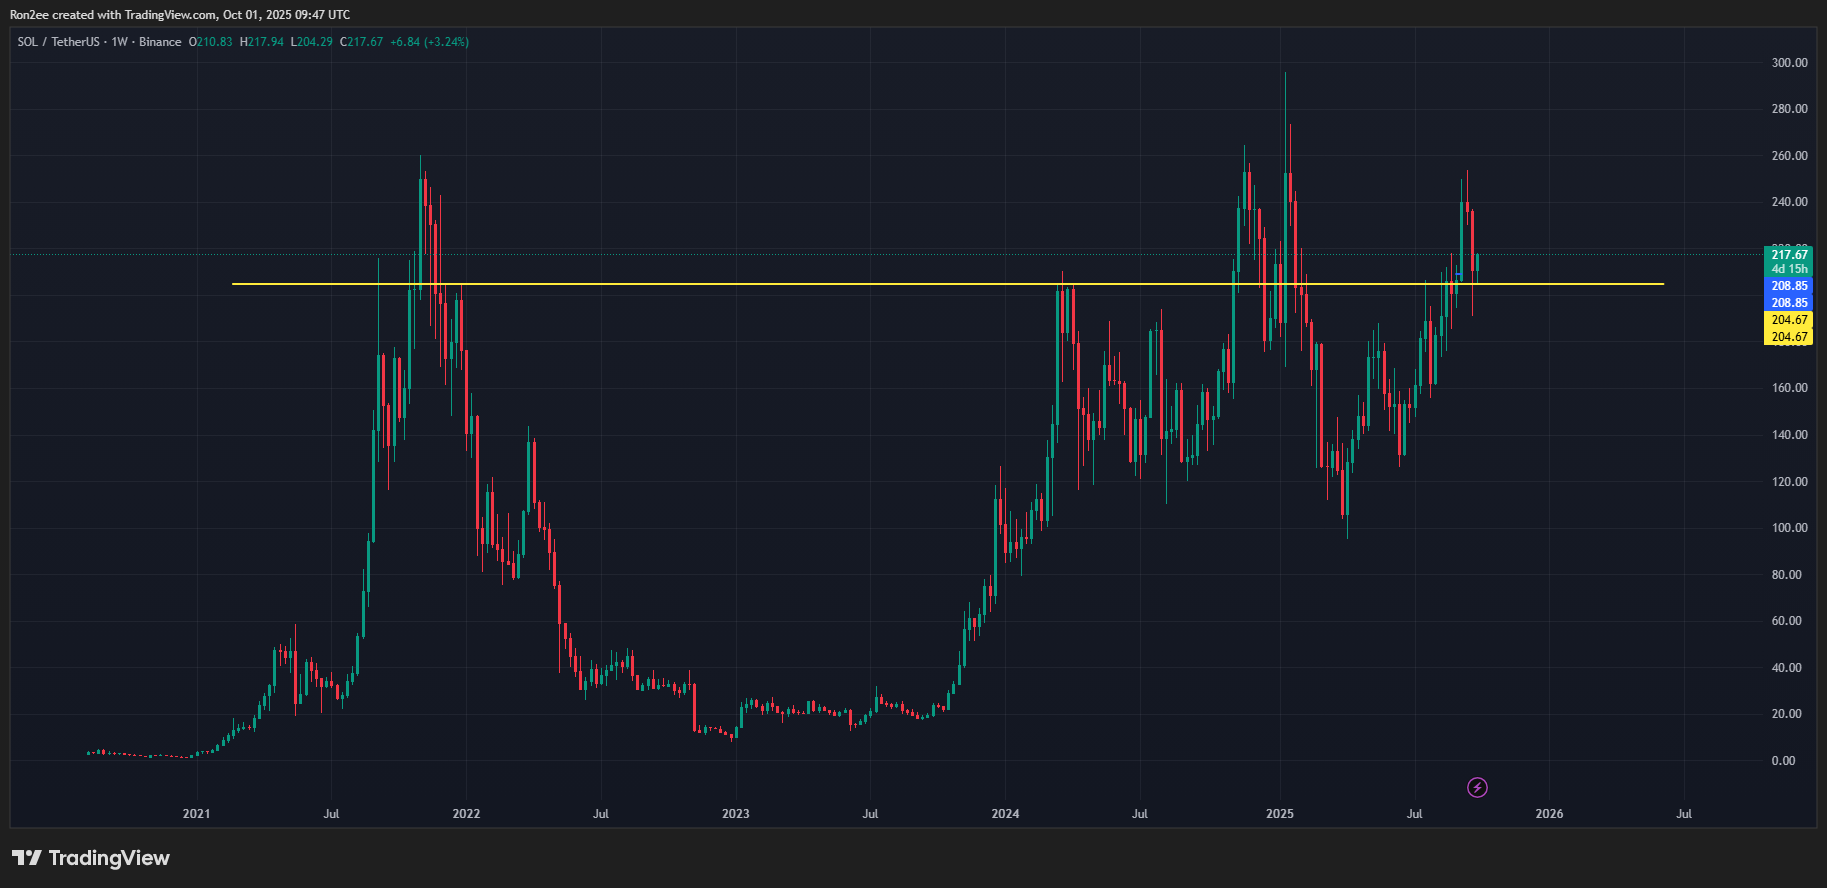
On the weekly chart, Solana has turned the $204-206 level into support, a level that has historically acted as key resistance on multiple occasions over the past four years.
Data from blockchain analytics firm Nansen reveal that smart money, that is, institutional traders who have a proven record of success, appears to be an active part of the new accumulation trend.
Investments from smart money often drive follow-up interest among retail traders, who tend to follow these moves when building their portfolios.
Derivatives data tell a similar story of pressure building under the surface. The Solana liquidity heatmap from CoinGlass over the past few days reveals a high density of short liquidations (yellow bands) clustered around the $213–$219 range, just above its current price level. In contrast, the heatmap is much cooler below the price, suggesting fewer long positions at risk of liquidation.
With the current market scenario indicating that buyers are pressuring sellers, this setup could lead to a potential short squeeze, accelerating gains if SOL pushes higher into that zone.
Meanwhile, investors are also hyped over the potential launch of a Solana ETF in the U.S., especially now that approval odds have improved significantly following the SEC’s decision to streamline the crypto ETF review process.
The launch of an SOL ETF would likely drive substantial demand from institutional traders, as it would provide regulated exposure to Solana while also expanding market liquidity, factors that could drive sustained gains for the token.
Solana price analysis
Technical indicators also seem to support the bull case for SOL price. On the weekly chart, the 20-day simple moving average is eyeing a bullish crossover with the 50-day SMA, a sign of strengthening bullish momentum and the potential for sustained price gains.
Solana price is also close to confirming a multi-year cup and handle pattern, characterized by a U-shaped trough (the cup) followed by a smaller downward-sloping handle. In technical analysis, when the price breaks out of a cup and handle pattern, it is often followed by sustained upside rallies.
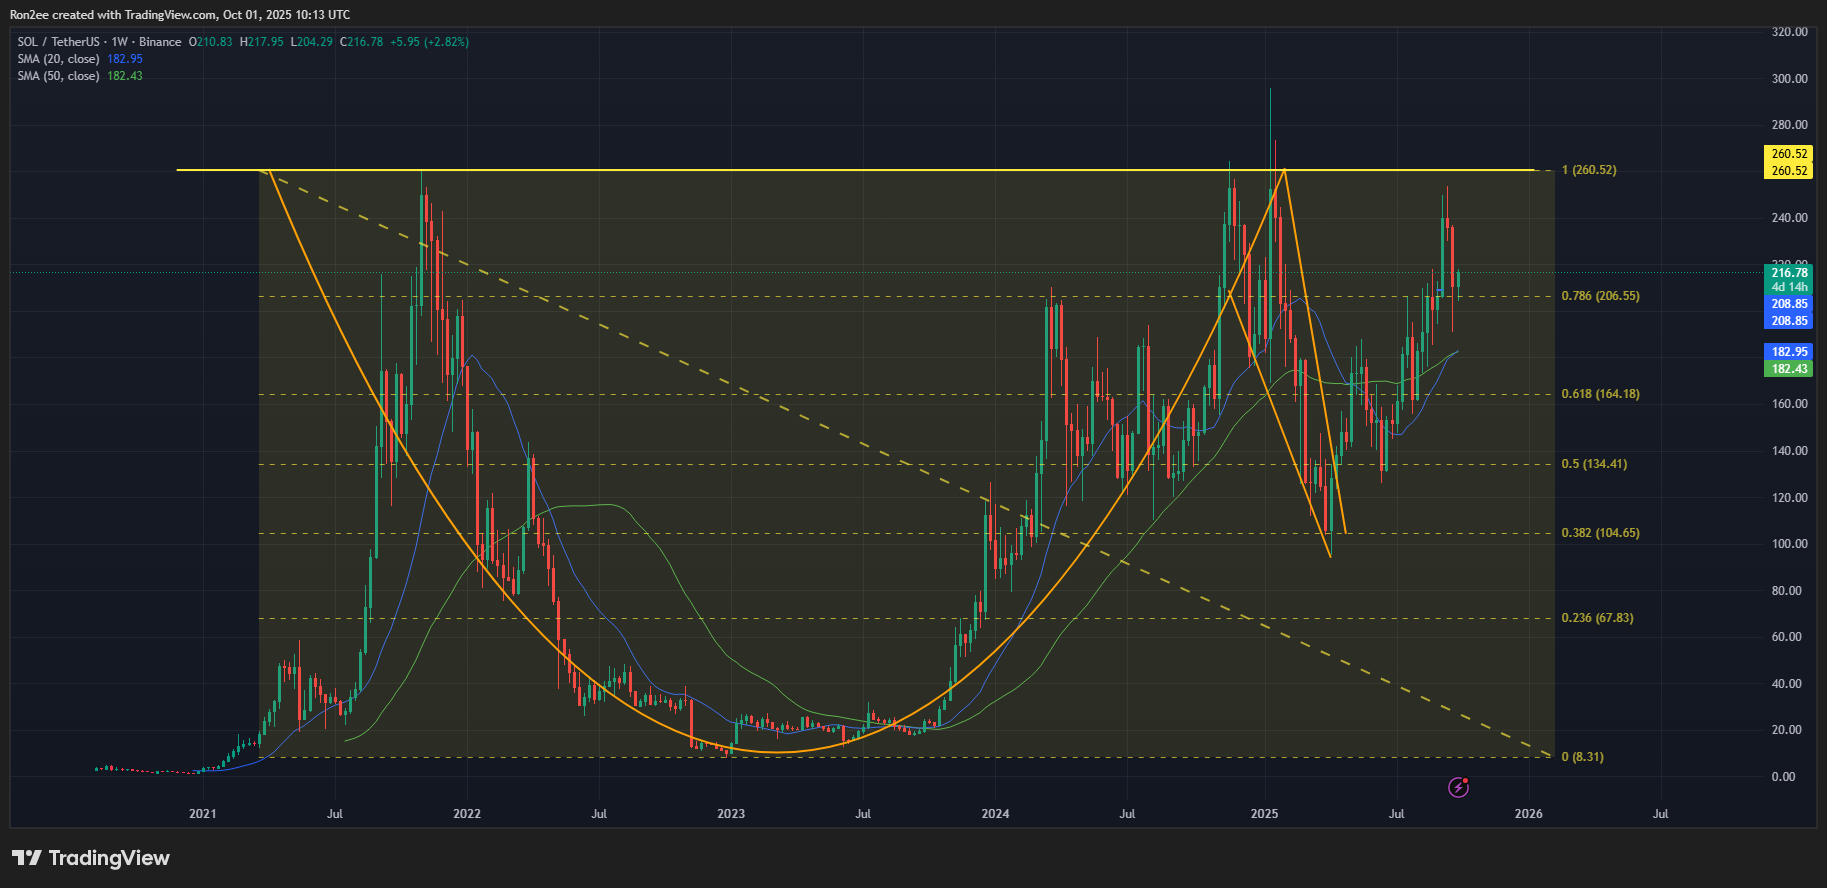
At press time, SOL was trading just 20% below the neckline of the pattern at $260, which would confirm the breakout. However, if SOL fails to hold the $204 support, which also aligns closely with the 78.6% Fibonacci retracement level, the setup would be invalidated.
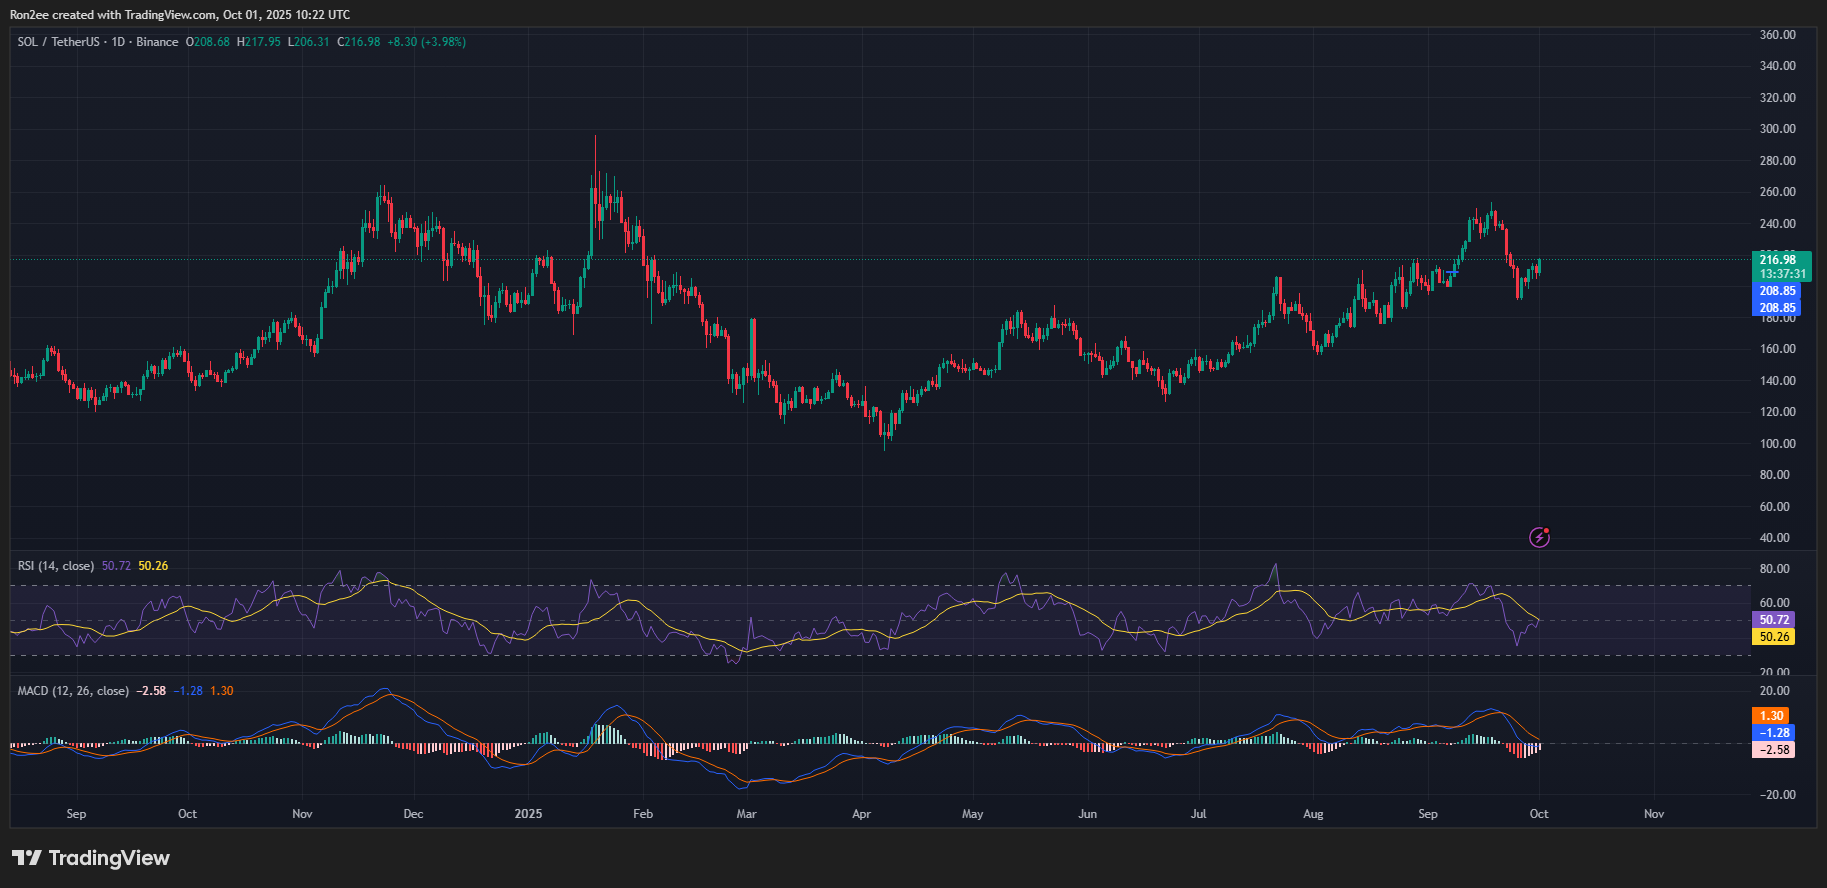
On the daily timeframe, the RSI is at 50, which means there’s still room for growth before it hits overbought levels. Meanwhile, the MACD line is slowly approaching a positive crossover, which traders may perceive as an early signal that momentum is shifting back in favor of the bulls.
As such, SOL may continue to rise in the short term towards $253, which marks its September high.
Disclosure: This article does not represent investment advice. The content and materials featured on this page are for educational purposes only.


