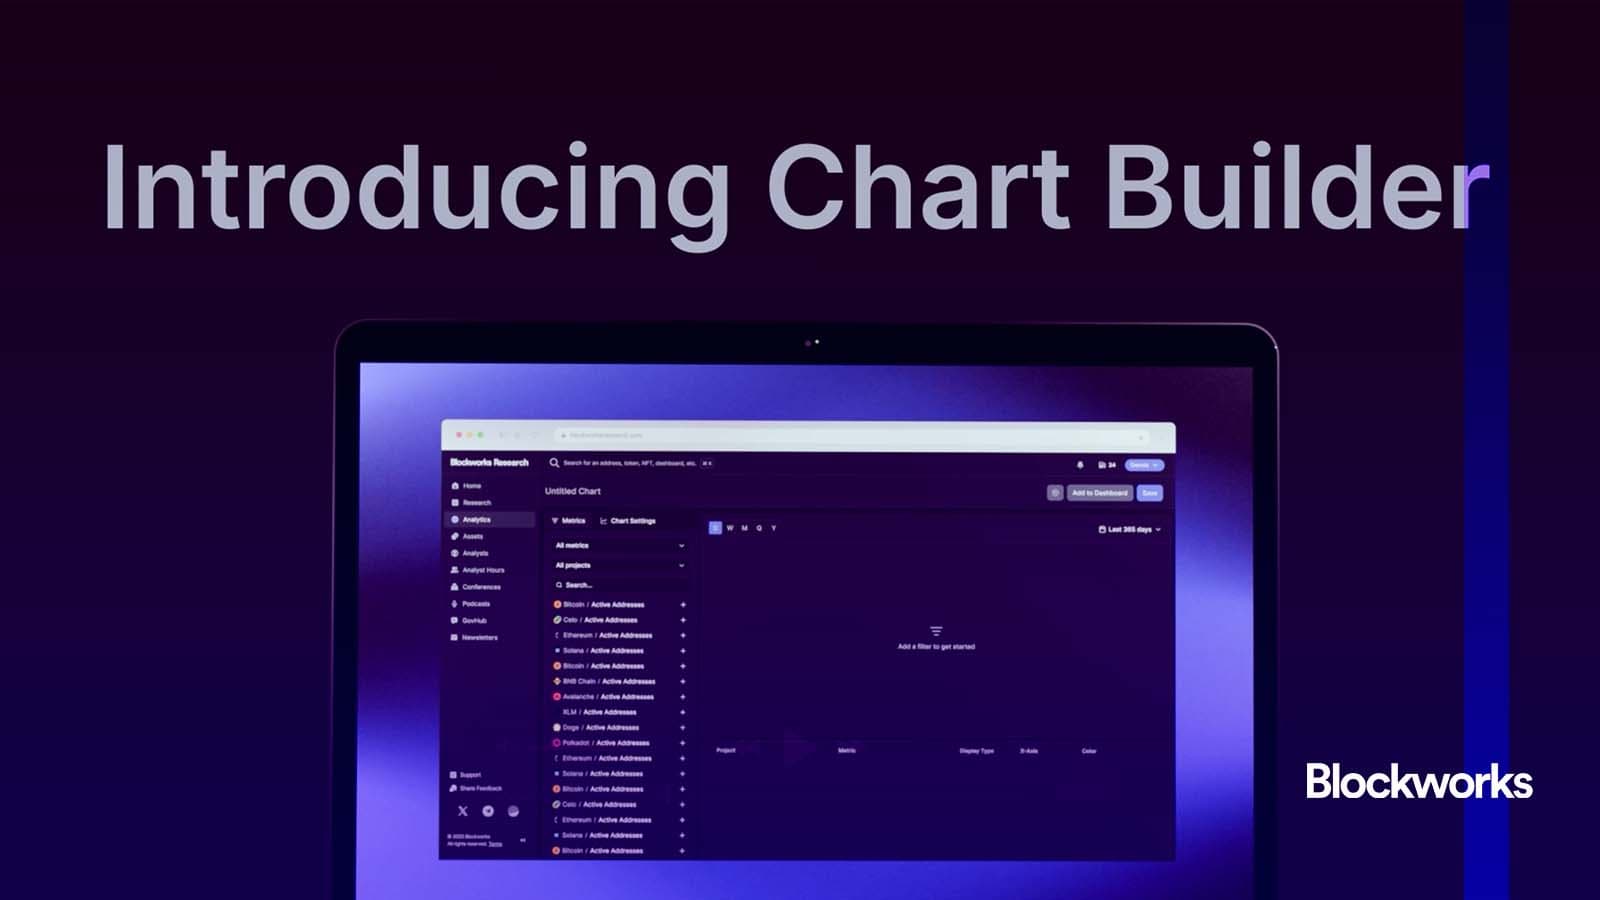
A no-code workspace to shape Blockworks data into custom visuals. Live today!

Default charts are a good start. Clear conviction requires more.
Chart Builder gives you the freedom to present trusted Blockworks data the way your analysis actually flows without code, exports, or detours.
Compare signals, change timeframes, group by protocol. Live on Blockworks Research.
Why Chart Builder?
- Design the view, not the pipeline. Start from Blockworks’ validated data and mold the visual that tells the truth fastest.
- Move from idea to insight in minutes. Compare signals, switch lenses, annotate the story. No CSV babysitting, just the insight you need immediately.
- Flexible by design. Lines, bars, areas, tables; single series or comparisons; quick filters and timeframes that match the way you work.
- Consistency you can trust. Every chart is fed by the same warehouse that powers Blockworks Research.
Pick what you need from the catalog, shape the presentation, and save it. That’s it. Your definitions stay intact; your charts stay fresh.
Integrated with Dashboard Builder
Chart Builder now slots directly into Dashboard Builder. Build a chart once, then drop it onto your own dashboard alongside tables, notes, and other tiles.
Create a living view of the KPIs that matter, keep narrative context in one place, and let everything update automatically. No screenshots, no manual refresh cycles. All of your signal in one place.
You could build:
- A set of focused KPI tiles focused on the things you care about.
- A side-by-side comparison that shows you clear market share trends in a given sector.
- A leaderboard table that ranks your favorite metrics across all time periods.
- A daily-refreshing table for reporting that completely replaces the team’s monotonous work.
The possibilities are immense when you combine the depth of Blockworks data with the flexibility of crafting your own charts and dashboards in one elegant interface.
Try it today
Chart Builder is live inside Blockworks Research. Open it, shape the view, and pin it to your dashboard.
Less wrangling. More decisions.
Questions or ideas? [email protected].
Get the news in your inbox. Explore Blockworks newsletters:
- The Breakdown: Decoding crypto and the markets. Daily.
- 0xResearch: Alpha in your inbox. Think like an analyst.
- Empire: Crypto news and analysis to start your day.
- Forward Guidance: The intersection of crypto, macro and policy.
- The Drop: Apps, games, memes and more.
- Lightspeed: All things Solana.
- Supply Shock: Bitcoin, bitcoin, bitcoin.
Decoding crypto and the markets. Daily, with Byron Gilliam.
Mon – Wed, October 13 – 15, 2025
Blockworks’ Digital Asset Summit (DAS) will feature conversations between the builders, allocators, and legislators who will shape the trajectory of the digital asset ecosystem in the US and abroad.
Research
Figure, founded by former SoFi CEO Mike Cagney, has emerged as a leader in onchain RWAs, with ~$17.5B publicly tokenized. The platform’s ecosystem volume is growing ~40% YoY as it expands beyond HELOCs into student loans, DSCR loans, unsecured loans, bankruptcy claims, and more. Operationally, Figure cuts average loan production cost by ~93% and compresses median funding time from ~42 days to ~10, creating a durable speed-and-cost advantage.
news
Breaking headlines across our core coverage categories.
Risk Committee confirms conditions met, with governance vote to finalize Ethena’s revenue-sharing framework for ENA holders
The new Ethereum Foundation initiative aims to standardize AI-agent protocols and build a decentralized AI stack for long-term use
Helius, backed by Pantera and Summer Capital, will acquire SOL as reserve asset in new Nasdaq-listed treasury strategy
The deal adds experienced fintech leadership as MoonPay builds a regulated network linking banks, cards, stablecoins and blockchains


