


Reason to trust
![]()
Strict editorial policy that focuses on accuracy, relevance, and impartiality
Created by industry experts and meticulously reviewed
The highest standards in reporting and publishing
How Our News is Made
Strict editorial policy that focuses on accuracy, relevance, and impartiality
Ad discliamer
Morbi pretium leo et nisl aliquam mollis. Quisque arcu lorem, ultricies quis pellentesque nec, ullamcorper eu odio.
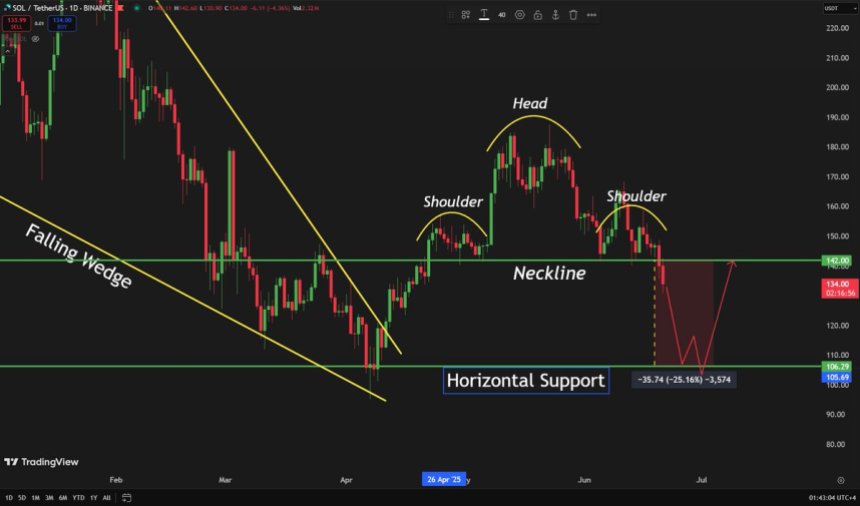
Solana has broken down decisively, losing a critical support level following news that the United States launched an attack on Iranian nuclear facilities. The unexpected geopolitical development triggered widespread panic across financial markets, with altcoins taking the hardest hit. Solana, in particular, has seen significant selling pressure, dropping 20% from its May high of approximately $185 and now trading near $148.
This breakdown confirms investor concerns that SOL’s uptrend has weakened. Top analyst Carl Runefelt noted that Solana has completed a Head and Shoulders pattern—a bearish technical structure often signaling deeper downside. The price has broken below the neckline of this pattern, confirming the potential for continued declines in the short term.
Adding to the bearish outlook is Solana’s inability to reclaim its prior support levels during brief bounces. With momentum indicators turning negative and broader market sentiment rattled, the likelihood of a swift recovery appears slim unless macro conditions stabilize.
Solana Faces Deeper Correction As Bearish Pattern Unfolds
Solana’s bullish momentum from late 2024 has all but faded, replaced by stagnation and sharp corrections as market conditions worsen. Now trading more than 50% below its all-time high, SOL continues to struggle under the weight of global macroeconomic uncertainty and rising geopolitical tensions. The US military strike on Iranian nuclear facilities has only added to the volatility, sending shockwaves through both traditional and crypto markets.
While Solana was one of the strongest performers during the previous cycle, its price action has turned decisively bearish in recent weeks. Bulls have failed to maintain critical support levels, and the asset has now broken below its short-term trend structures. According to Runefelt, Solana has completed a Head and Shoulders pattern, a classic technical signal that often precedes a prolonged downtrend. The pattern’s neckline has been breached, and the projected bearish target now stands around $106.30—a level not seen since February.
The breakdown also reflects broader weakness in the altcoin market. Despite earlier hopes for an altseason, capital has rotated out of risk assets, favoring Bitcoin and stablecoins amid uncertainty. Solana’s inability to reclaim prior highs or establish higher lows points to a market in retreat. Momentum indicators continue to flash red, and unless bulls reclaim lost ground quickly, SOL could be facing an extended period of consolidation or further losses.
SOL Price Analysis: Breaking Below Key Support
Solana is under pressure as it breaks below the critical 200-day simple moving average (SMA) around $149.54, a level that had previously acted as dynamic support. This breakdown signals growing bearish sentiment as price action confirms a loss of momentum following weeks of consolidation below the $155–$160 resistance zone. As of now, SOL is trading at approximately $135.99, down nearly 3% on the day and over 20% from its May highs.
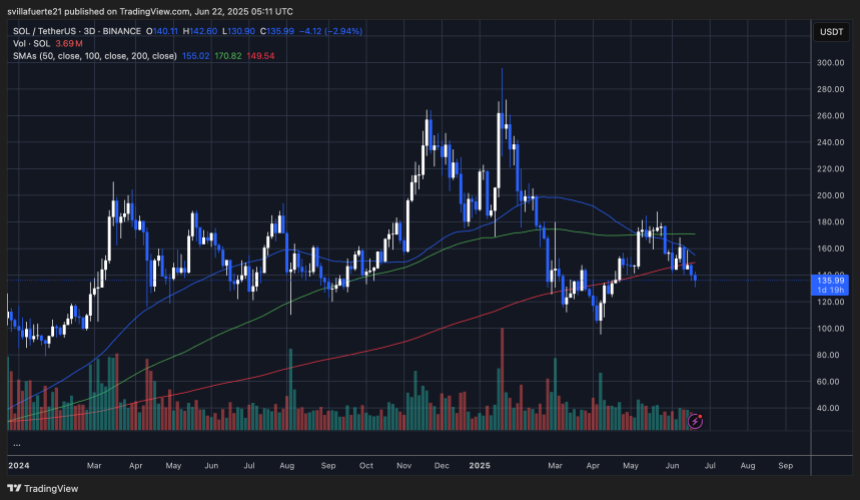
The chart shows a rejection near the 100-day SMA (green line), and the sustained move below both the 200-day and 50-day SMAs (blue line) points to a shifting structure, leaning heavily toward the downside. Volume remains elevated on red candles, confirming that the breakdown is supported by increasing sell pressure rather than a low-liquidity move.
If the current trend continues, Solana could revisit the $120–$125 range, which previously served as strong support in early Q1 2025. The broader context of macroeconomic volatility and geopolitical tension, particularly the recent U.S. attack on Iran, adds to investor unease across risk assets, including altcoins like Solana. A daily close back above $149 would be needed to neutralize the short-term bearish structure and shift sentiment. Until then, downside risks dominate.
Featured image from Dall-E, chart from TradingView

Sebastian’s journey into the world of crypto began four years ago, driven by a fascination with the potential of blockchain technology to revolutionize financial systems. His initial exploration focused on understanding the intricacies of various crypto projects, particularly those focused on building innovative financial solutions. Through countless hours of research and learning, Sebastian developed a deep understanding of the underlying technologies, market dynamics, and potential applications of cryptocurrencies.
To share his insights with others, Sebastian became an active contributor to online discussions on platforms like X and LinkedIn. His focus on fintech and crypto-related topics quickly established him as a trusted voice in the online crypto community. Sebastian’s goal was to educate and inform his audience about the latest trends and insights in the rapidly evolving crypto landscape.
To further enhance his expertise, Sebastian pursued a UC Berkeley Fintech: Frameworks, Applications, and Strategies certification. This rigorous program equipped him with valuable skills and knowledge regarding Financial Technology, bridging the gap between traditional finance and decentralized finance. The certification deepened his understanding of the broader financial landscape and its intersection with blockchain technology.
Sebastian’s passion for finance and writing is evident in his work. He enjoys delving into financial research, analyzing market trends, and exploring the latest developments in the crypto space. In his spare time, Sebastian can often be found immersed in charts, studying 10-K reports, or engaging in thought-provoking discussions about the future of finance.
Sebastian’s journey as a crypto pioneer has been marked by a relentless pursuit of knowledge and a dedication to sharing his insights. His ability to navigate the complex world of crypto, combined with his passion for financial research and communication, makes him a valuable contributor to the industry. As the crypto landscape continues to evolve, Sebastian remains at the forefront, providing valuable insights and helping to shape the future of this revolutionary technology.
Disclaimer: The information found on NewsBTC is for educational purposes only. It does not represent the opinions of NewsBTC on whether to buy, sell or hold any investments and naturally investing carries risks. You are advised to conduct your own research before making any investment decisions. Use information provided on this website entirely at your own risk.


