


Reason to trust
![]()
Strict editorial policy that focuses on accuracy, relevance, and impartiality
Created by industry experts and meticulously reviewed
The highest standards in reporting and publishing
How Our News is Made
Strict editorial policy that focuses on accuracy, relevance, and impartiality
Ad discliamer
Morbi pretium leo et nisl aliquam mollis. Quisque arcu lorem, ultricies quis pellentesque nec, ullamcorper eu odio.
Bitcoin’s price action in the past 24 hours has been nothing short of remarkable. After consolidating for several days in a tightening range, the market broke past the $105,503 support-turned-resistance zone earlier in the week and kicked off a steep climb in the past trading day. This has allowed Bitcoin to push into new all-time high levels, and is showing no signs of slowing down.
Interestingly, technical analysis shows the rally comes off an approach of a golden cross between the 50 and 200-day moving averages, but FX_Professor offered a different take on the much-celebrated golden cross.
Analyst Disputes Golden Cross Hype As Late Signal
In a recent analysis published on TradingView, FX_Professor discussed a different take on Bitcoin’s golden cross. While most market commentators interpret this crossover of the 50-day simple moving average above the 200-day as a strong bullish confirmation, the analyst dismissed it as a delayed indicator. The analyst described it as the afterparty where retail investors arrive late to the scene.
Instead of waiting for the golden cross to flash green, FX_Professor noted pre-indicator pressure zones as the real signal of value. In the case of Bitcoin’s price action in recent months, the analyst pointed out the $74,394 and $79,000 region as the zone of accumulation and early positioning, well before the golden cross became visible. As such, by the time the cross appeared recently, Bitcoin’s price action had already been up significantly.
The golden cross is often used by traders as a signal to enter a long position, as it suggests that the asset’s price is likely to continue rising. However, this analysis follows a trend among experienced traders who view the golden cross as more of a lagging confirmation than a trigger of a rally.
Early Entry Zones And Structure Matter More, Analyst Says
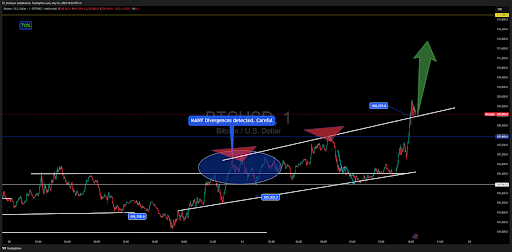
According to FX_Professor, indicators such as EMAs or SMAs can be useful but should never come before understanding the price structure, trendlines, and real-time pressure zones. He shared a snapshot of his own Bitcoin price chart that combines custom EMAs with a signature parallelogram method to detect where price tension begins to build. Visible on the chart are entries forming as early as April when Bitcoin bounced off support around $74,000, long before the crossover confirmation.
Now, with Bitcoin pushing toward the next target zone near $113,000, the analyst’s strategy continues to validate itself in real time. Nonetheless, the confirmation of a golden cross is still bullish for Bitcoin’s price action moving forward, even if the price rally is already halfway to its peak level.
At the time of writing, Bitcoin is trading at $110,734. This marks a slight pullback from the new all-time high of $111,544, which was registered just three hours ago. The Bitcoin price is still up by 3.1% in the past 24 hours, and new all-time highs are possible before the weekly close.
Featured image from Getty Images, chart from Tradingview.com

Scott Matherson is a prominent crypto writer at NewsBTC with a knack for capturing the pulse of the market, covering pivotal shifts, technological advancements, and regulatory changes with precision. Having witnessed the evolving landscape of the crypto world firsthand, Scott is able to dissect complex crypto topics and present them in an accessible and engaging manner. Scott’s dedication to clarity and accuracy has made him an indispensable asset, helping to demystify the complex world of cryptocurrency for countless readers.
Scott’s experience spans a number of industries outside of crypto including banking and investment. He has brought his vast experience from these industries into crypto, which allows him to understand even the most complex topics and break them down in a way that is easy for readers from all works of life to understand. Scott’s pieces have helped to break down cryptocurrency processes and how they work, as well as the underlying groundbreaking technology that makes them so important to everyday life.
With years of experience in the crypto market, Scott began to focus on his true passion: writing. During this time, Scott has been able to author countless influential pieces that have drawn in millions of readers and have shaped public opinion across various important topics. His repertoire spans hundreds of articles on various sectors in the crypto industry, including decentralized finance (DeFi), decentralized exchanges (DEXes), Staking, Liquid Staking, emerging technologies, and non-fungible tokens (NFTs), among others.
Scott’s influence is not just limited to the countless discussions that his publications have sparked but also as a consultant for major projects in the space. He has consulted on issues ranging from crypto regulations to new technology deployment. Scott’s expertise also spans community building and contributes to a number of causes to further the development of the crypto industry.
Scott is an advocate for sustainable practices within the crypto industry and has championed discussions around green blockchain solutions. His ability to keep in line with market trends has made his work a favorite among crypto investors.
In his personal life, Scott is an avid traveler and his exposure to the world and various way of life has helped him to understand how important technologies like the blockchain and cryptocurrencies are. This has been key in his understanding of its global impact, as well as his ability to connect socio-economic developments to technological trends around the globe like no one else.
Scott is known for his work in community education to help people understand crypto technology and how its existence impacts their lives. He is a well-respected figure in his community, known for his work in helping to enlighten and inspire the next generation as they channel their energies into pressing issues. His work is a testament to his dedication and commitment to education and innovation, as well as the promotion of ethical practices in the rapidly developing world of cryptocurrencies.
Scott stands steady in the frontlines of the crypto revolution and is committed to helping to shape a future that promotes the development of technology in an ethical manner that translates to the benefit of all in the society.
Disclaimer: The information found on NewsBTC is for educational purposes only. It does not represent the opinions of NewsBTC on whether to buy, sell or hold any investments and naturally investing carries risks. You are advised to conduct your own research before making any investment decisions. Use information provided on this website entirely at your own risk.

-heats-up:-upside-move-hints-at-major-breakout-ahead")
