


Reason to trust
![]()
Strict editorial policy that focuses on accuracy, relevance, and impartiality
Created by industry experts and meticulously reviewed
The highest standards in reporting and publishing
How Our News is Made
Strict editorial policy that focuses on accuracy, relevance, and impartiality
Ad discliamer
Morbi pretium leo et nisl aliquam mollis. Quisque arcu lorem, ultricies quis pellentesque nec, ullamcorper eu odio.
According to a recent CryptoQuant Quicktake post by contributor burakkemeci, Bitcoin (BTC) is beginning to show signs of a trend reversal after weeks of downward movement. Notably, BTC surged past $100,000 yesterday for the first time since February 3.
Bitcoin On The Verge Of Trend Reversal?
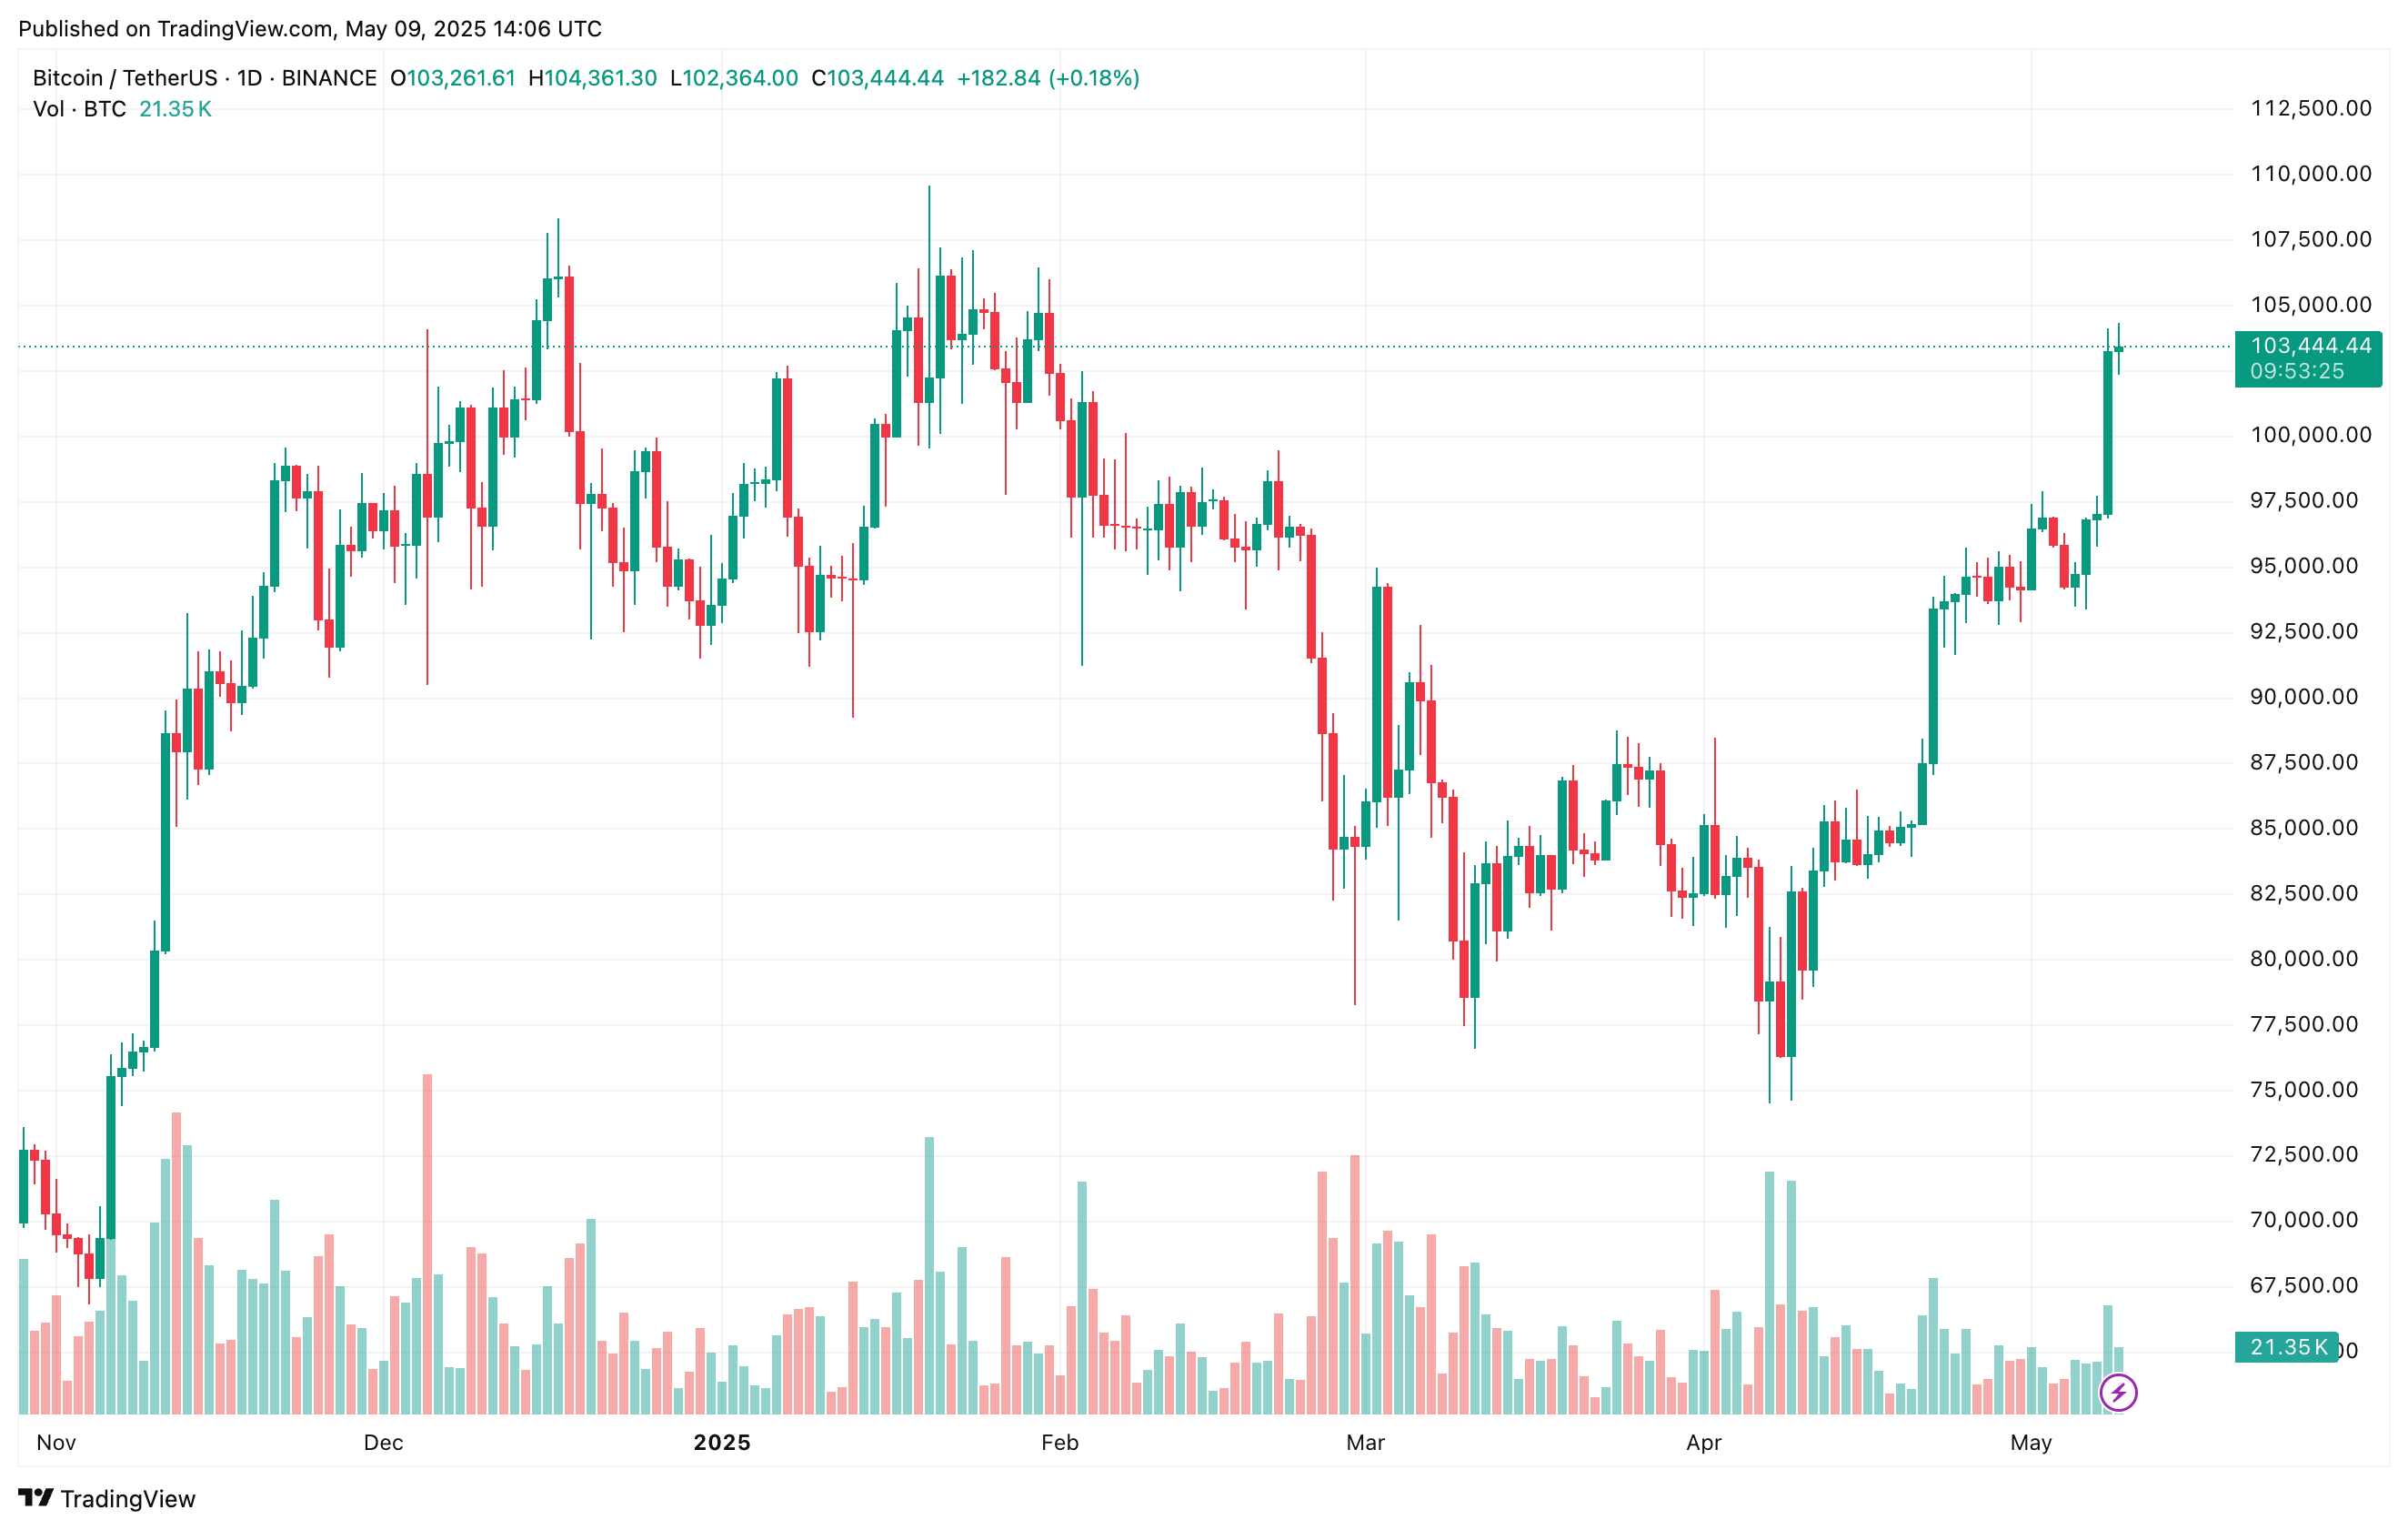
At the time of writing, Bitcoin is trading slightly above $100,000, approximately 5.2% below its all-time high (ATH) of $108,786, set earlier this year on January 20. The leading cryptocurrency has staged an impressive rebound of over 20% from its recent low of $74,508 recorded on April 6.
In their analysis, crypto analyst burakkemeci referred to the CryptoQuant Bull-Bear Market Cycle indicator, saying that it is flashing the early signs of a potential bullish trend reversal. The analyst noted:
With Bitcoin surging back above $100K, the indicator has started flashing bullish signals again – for the first time in weeks. Although the signal is still weak (coefficient: 0.029), the mere appearance of a positive shift is encouraging.

To explain, the CryptoQuant Bull-Bear Market Cycle indicator is an on-chain tool that tracks long-term and short-term market sentiment by comparing price momentum and investor behavior trends. It uses two key components – the 30-day and 365-day moving averages (MA) – to identify shifts between bull and bear cycles.
Importantly, the analyst pointed out that the Bull-Bear 30-day MA has started to turn upward. If this metric crosses above the 365-day MA, historical trends suggest Bitcoin could enter a phase of parabolic price growth.
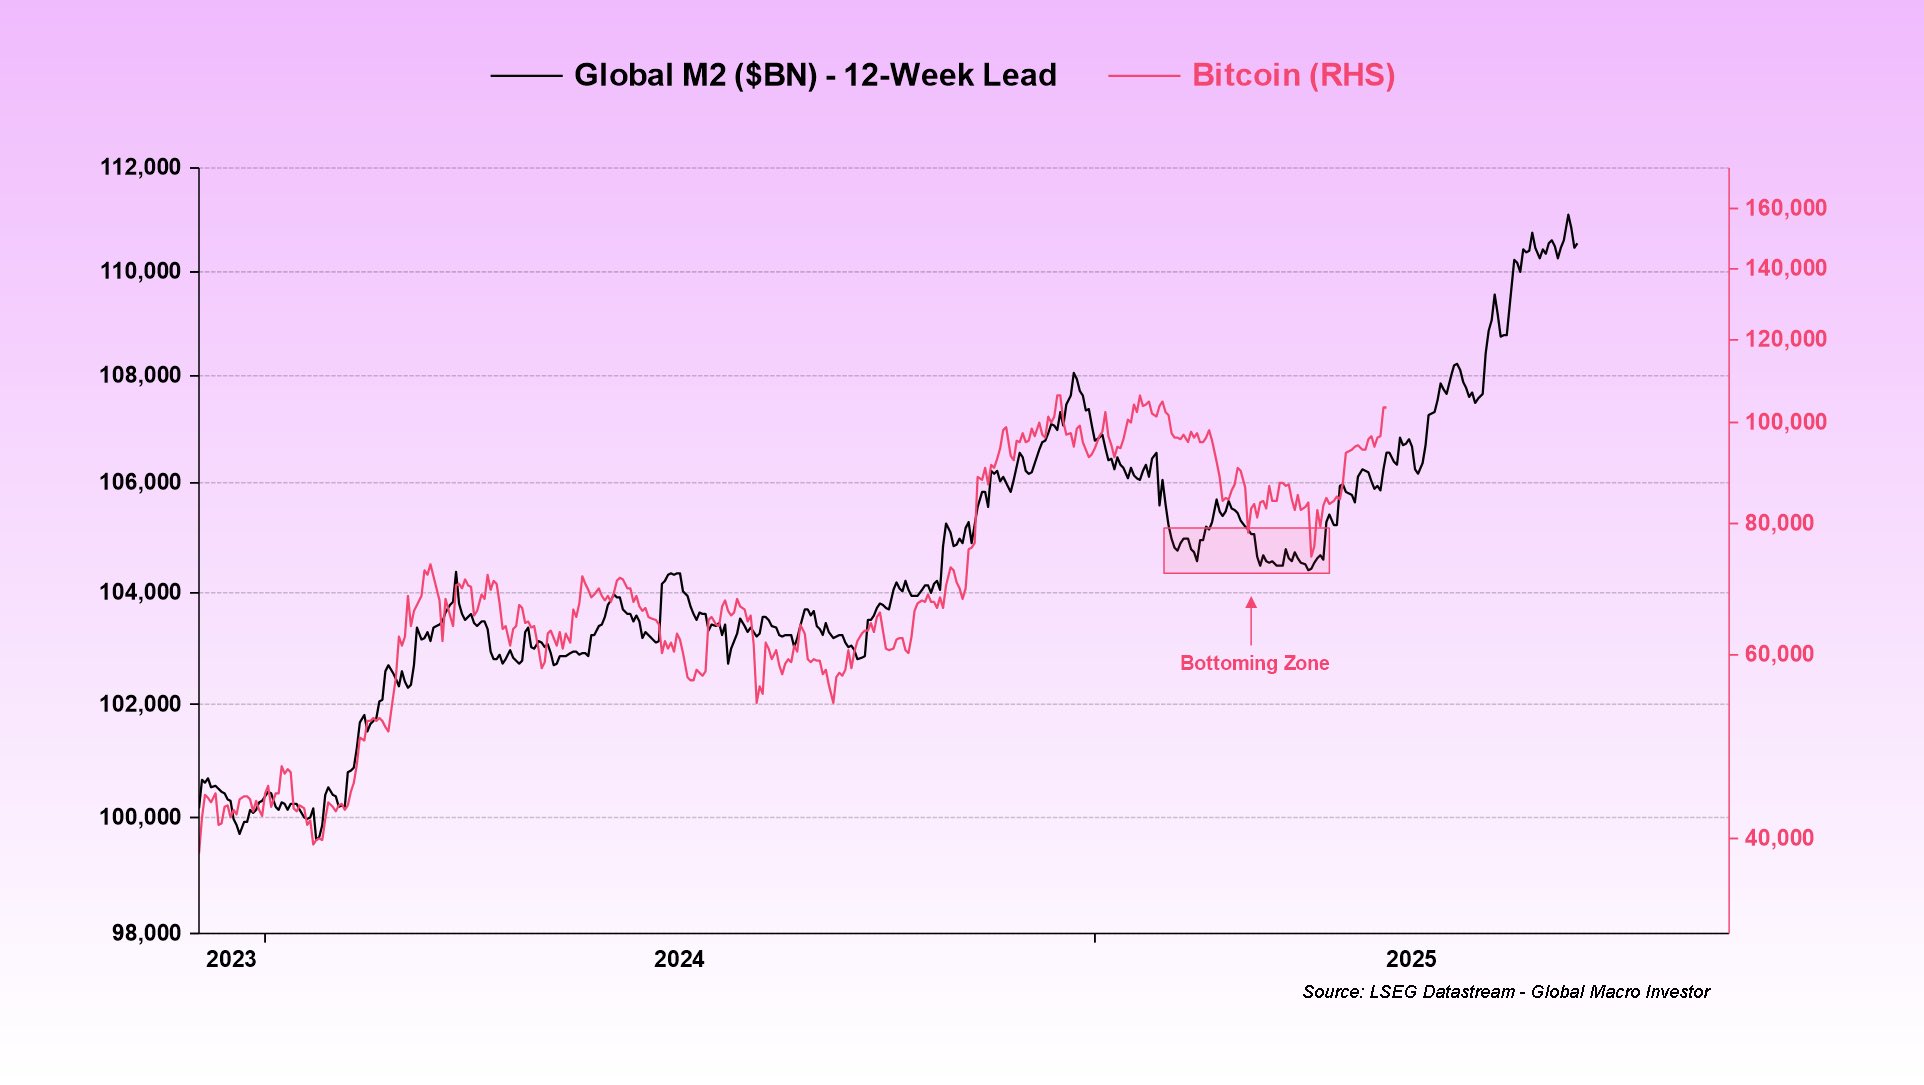
Recent macroeconomic developments may further support the bullish narrative for Bitcoin. Julien Bittel, Head of Macro Research at Global Macro Investor, recently highlighted the relationship between the global M2 money supply and the price of BTC.
Bittel shared a chart that overlays BTC’s price with the M2 money supply, adjusted with a 12-week lag. The data reveals a steep increase in global liquidity since early 2025, implying that BTC could follow this trend and continue rising in the months ahead.
Warning Signs Still Linger For BTC
Despite recent strength, not all signals are bullish. Analysts caution that the current rally has been accompanied by aggressive profit-taking, increasing the chances of a local top forming.
Further, recent analysis shows that BTC’s Demand Momentum is yet to come out of negative territory. The analyst noted that such market behavior is mostly prevalent during late-cycle distribution phases or macro-level consolidation periods.
That said, Bitcoin’s Stochastic Relative Strength Index (RSI) is beginning to reflect renewed bullish momentum. At press time, BTC trades at $103,444, up 4% in the past 24 hours.
Featured image created with Unsplash, charts from CryptoQuant, X, and TradingView.com

Ash is a dedicated crypto researcher and blockchain enthusiast with a passion for diving deep into the evolving world of decentralized technologies. With a background in writing and a natural curiosity for how digital assets are shaping the future, he has immersed himself in various sectors of the cryptocurrency space, including decentralized finance (DeFi), NFTs, and liquidity mining. His journey into crypto started with a desire to fully understand the technology behind it, leading him to explore and engage with these systems firsthand.
Ash’s approach to DeFi goes beyond surface-level research as he actively participates in decentralized protocols, testing their functionality to gain a deeper understanding of how they operate. From experimenting with staking mechanisms to exploring liquidity mining strategies, he is hands-on in his exploration, which allows him to provide practical, real-world insights that go far beyond theoretical knowledge. This immersive experience has helped him develop a comprehensive grasp of smart contracts, token governance, and the broader implications of decentralized platforms on the future of finance.
In the NFT space, Ash’s interest is driven by the technology’s potential to reshape ownership and creativity in the digital age. He has explored various NFT projects, gaining insights into how these digital assets function within different ecosystems. His focus is on understanding the evolving relationship between creators and communities, as well as the innovative uses of blockchain technology to establish authenticity and provenance in the digital world. Ash’s research in this area often touches on the intersection of culture, technology, and community-driven projects.
A key area of his expertise lies in liquidity mining, where he has engaged with various decentralized platforms to understand how liquidity provision contributes to the functionality and security of DeFi ecosystems. Ash’s hands-on involvement has allowed him to analyze the risks, rewards, and broader implications of liquidity pools, giving him a well-rounded perspective on this integral part of DeFi. His understanding of risk management and protocol design allows him to provide insights into how these systems can be navigated effectively, with an emphasis on both opportunity and caution.
When it comes to communicating these complex topics, Ash’s writing is grounded in clarity and depth. He excels at breaking down intricate blockchain concepts into easily digestible information for a wide audience. Whether explaining the workings of decentralized exchanges or outlining the future potential of blockchain technology, Ash ensures that his content is accessible to both those new to the space and experienced participants looking for deeper insights.
Beyond DeFi and NFTs, Ash explores a wide array of emerging blockchain applications. His research spans areas like cross-chain technologies, decentralized governance, and blockchain’s potential to integrate with traditional finance. He is continuously learning and adapting to the latest developments, ensuring that his insights are both timely and relevant. His interest extends to how these technologies are creating new possibilities for decentralization, transparency, and trust in a variety of industries.
Ash’s commitment to engaging with the crypto space firsthand gives him a unique perspective that goes beyond what can be learned from research alone. His practical involvement allows him to stay ahead of the curve, offering readers and enthusiasts a clear and comprehensive understanding of the rapidly evolving world of blockchain. Whether delving into the technical mechanics of DeFi or exploring the cultural impact of NFTs, Ash’s approach is always rooted in curiosity, research, and a desire to make this technology accessible to all.
Disclaimer: The information found on NewsBTC is for educational purposes only. It does not represent the opinions of NewsBTC on whether to buy, sell or hold any investments and naturally investing carries risks. You are advised to conduct your own research before making any investment decisions. Use information provided on this website entirely at your own risk.


