


Reason to trust
![]()
Strict editorial policy that focuses on accuracy, relevance, and impartiality
Created by industry experts and meticulously reviewed
The highest standards in reporting and publishing
How Our News is Made
Strict editorial policy that focuses on accuracy, relevance, and impartiality
Ad discliamer
Morbi pretium leo et nisl aliquam mollis. Quisque arcu lorem, ultricies quis pellentesque nec, ullamcorper eu odio.
Data shows the Bitcoin derivatives trading volume has been higher than the spot one during BTC’s latest recovery rally beyond $100,000.
Bitcoin Trading Volume Ratio Has Declined Under The 1.0 Mark Recently
In a new post on X, CryptoQuant author Axel Adler Jr has talked about the trend in the Trading Volume Ratio for Bitcoin. The “Trading Volume Ratio” is an indicator that keeps track of the ratio between the amount of the asset becoming involved in trading on spot exchanges and that on derivatives ones.
When the value of this metric is greater than 1, it means the spot platforms are witnessing a higher amount of trading volume than the derivatives ones. On the other hand, it being under the threshold suggests the dominance of derivatives trading activity among the investors.
Now, here is the chart shared by the analyst that shows the trend in the Bitcoin Trading Volume Ratio over the last couple of years:
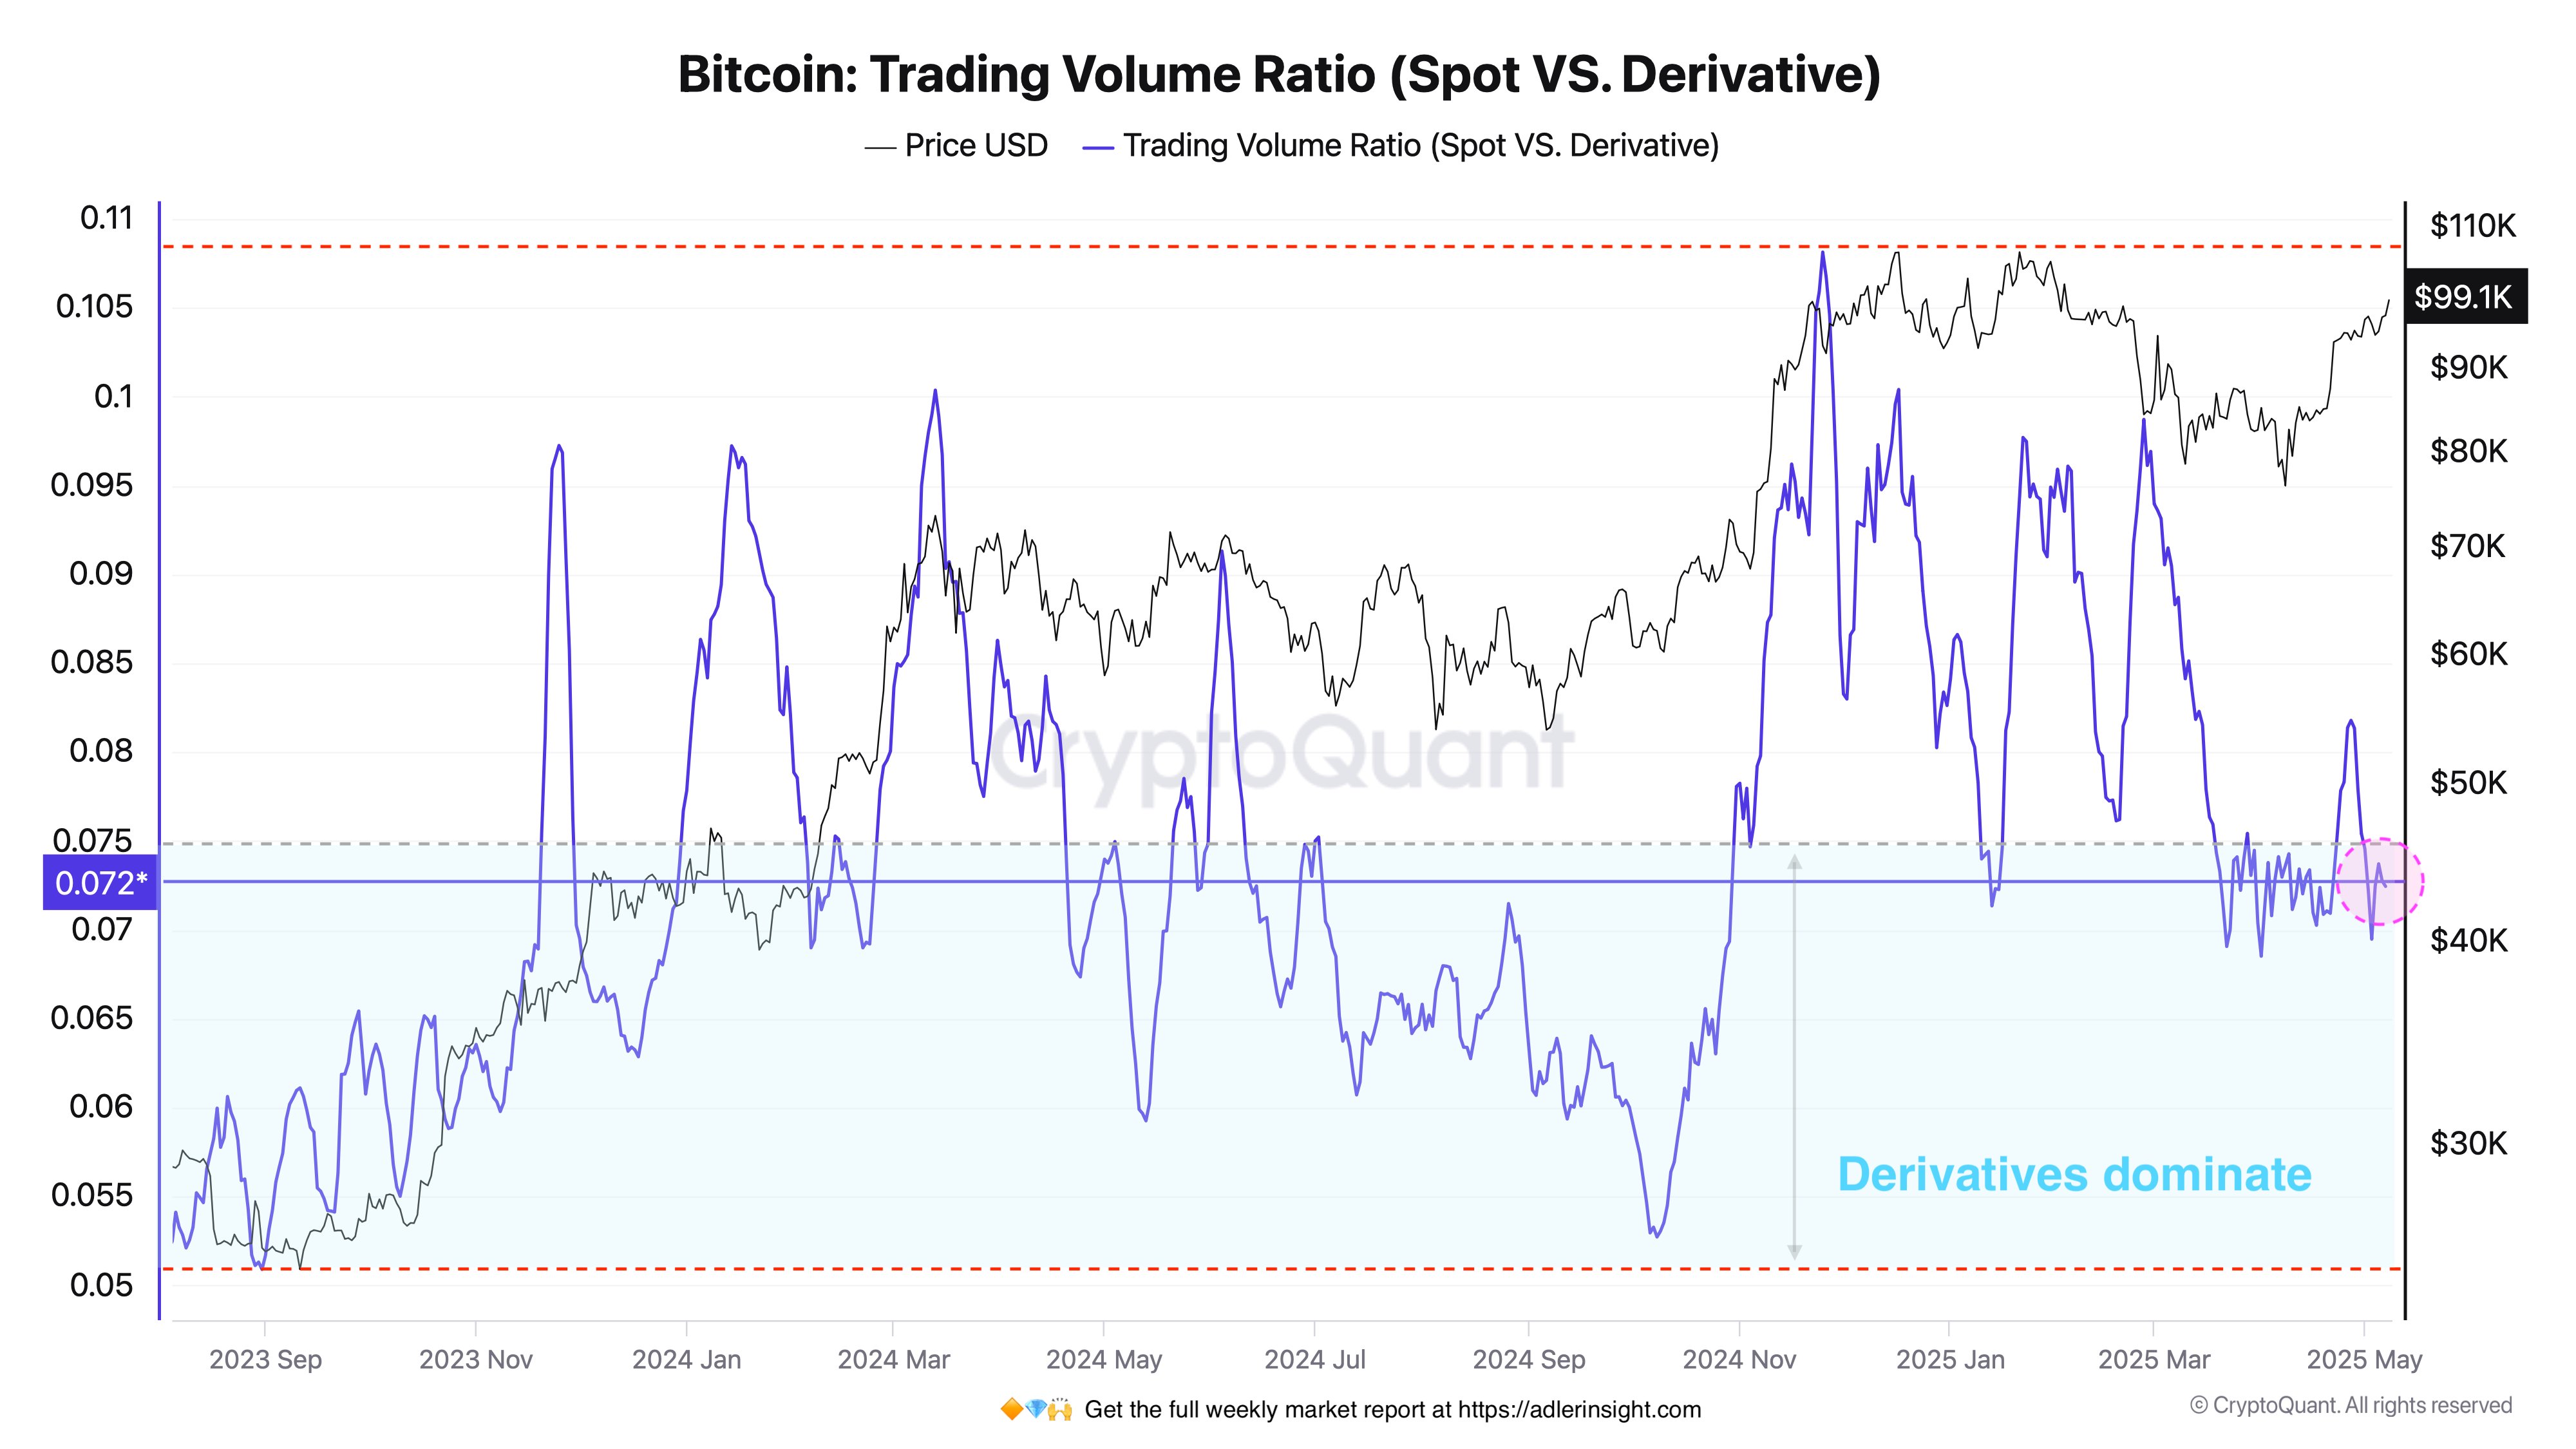
As displayed in the above graph, the Bitcoin Trading Volume Ratio has been sitting under the 1 mark recently, suggesting volume on the derivatives platforms has been outpacing that on the spot ones.
This has maintained while the cryptocurrency has gone through its latest leg of the recovery rally, which has taken its price back above the $100,000 level. From the chart, it’s visible that the trend was different during last month’s rally.
This previous leg of the run was accompanied by a spike in the Trading Volume Ratio above the 1 level, an indication that spot trades were potentially the main fuel behind it.
Historically, sustainable price rallies have generally been of this kind; runs that are borne out of high speculative activity on the derivatives market tend to be unstable.
Given that the derivatives market has dominated in this rally so far, it’s possible that it could have trouble lasting. Though, it only remains to be seen how things would develop for Bitcoin.
In some other news, Ethereum is extremely undervalued compared to Bitcoin, as the on-chain analytics firm CryptoQuant has revealed in an X post.
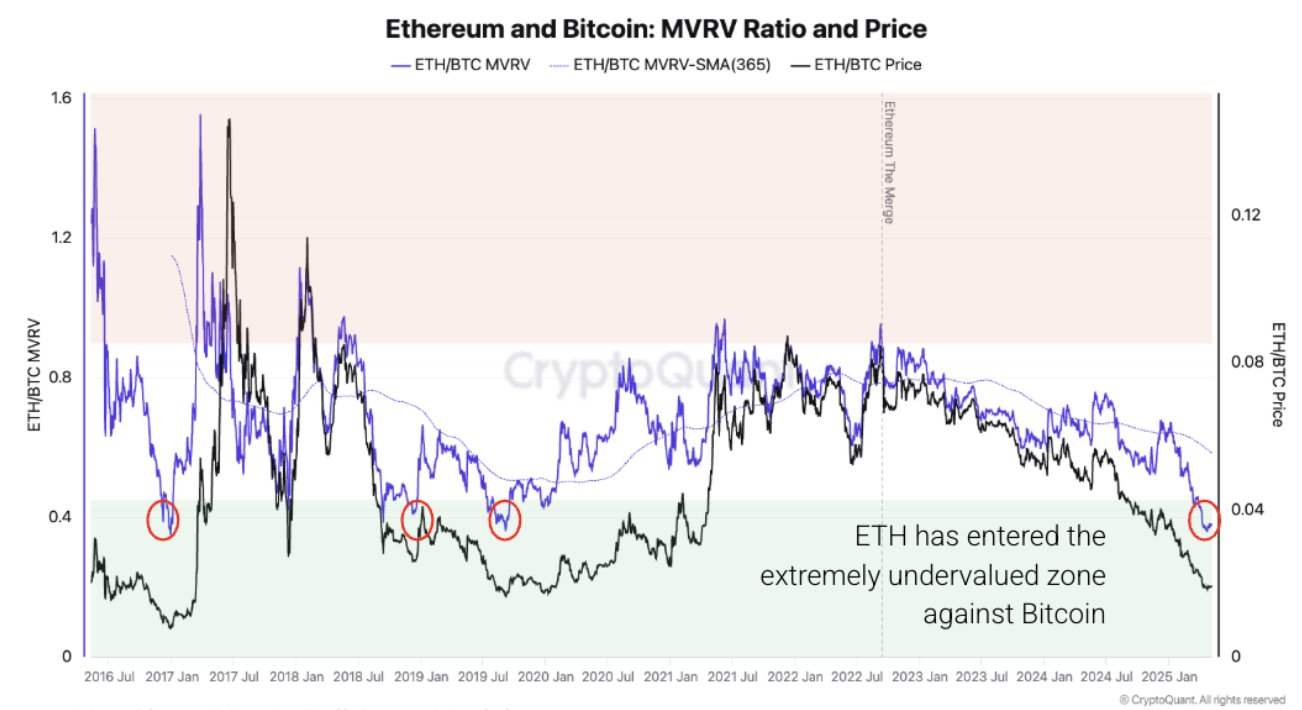
The indicator shared by the analytics firm is the ratio between the Ethereum and Bitcoin Market Value to Realized Value (MVRV) Ratios. The MVRV Ratio is a popular on-chain metric that basically keeps track of the profit-loss situation of the investors as a whole.
As is visible in the chart, the MVRV Ratio of ETH is very low compared to the one for BTC right now. “Historically, this led to Ethereum outperforming,” notes CryptoQuant. “However, supply pressure, weak demand, and flat activity could stall a rebound.”
BTC Price
Following a surge of nearly 3% in the last 24 hours, Bitcoin has managed to break above the $101,000 level.
Featured image from Dall-E, CryptoQuant.com, chart from TradingView.com

Keshav is currently a senior writer at NewsBTC and has been attached to the website since June 14, 2021.
Keshav has been writing for many years, first as a hobbyist and later as a freelancer. He has experience working in a variety of niches, even fiction at one point, but the cryptocurrency industry has been the longest he has been attached to.
In terms of official educational qualifications, Keshav holds a bachelor’s degree in Physics from one of the premier institutes of India, the University of Delhi (DU). He started the degree with an aim of eventually making a career in Physics, but the onset of COVID led to a shift in plans. The virus meant that the college classes had to be delivered in the online-mode and with it came free time for him to explore other passions.
Initially only seeking to make some beer money, Keshav unexpectedly landed clients offering real projects, after which there was no looking back. Writing was something he had always enjoyed and to be able to do it for a living was like a dream come true.
Keshav completed his Physics degree in 2022 and has been focusing on his writing career since, but that doesn’t mean his passion for Physics has ended. He eventually plans to re-enter university to obtain a masters degree in the same field, but perhaps only to satiate his own interest rather than for using it as a means to find employment..
Keshav has found blockchain and its concepts fascinating ever since he started going down the rabbit-hole back in 2020. On-chain analysis in particular has been something he likes to research more about, which is why his NewsBTC pieces tend to involve it in some form.
Being of the science background, Keshav likes if concepts are clear and consistent, so he generally explains the indicators he talks about in a bit of detail so that the readers can perhaps come out having understood and learnt something new.
As for hobbies, Keshav is super into football, anime, and videogames. He enjoys football not only as a watcher, but also as a player. For games, Keshav generally tends towards enjoying singleplayer adventures, with EA FC (formerly FIFA) being the only online game he is active in. Though, perhaps due to being ultra-focused on the game, he is today a semi-pro on the EA FC scene, regularly participating in tournaments and sometimes even taking back prize money.
Because of his enthusiasm for anime and games, he also self-learned Japanese along the way to consume some of the untranslated gems out there. The skill didn’t merely remain as just a hobby, either, as he put it to productive use during his exploration for small-time gigs at the start of COVID, fulfilling a couple of Japanese-to-English translation jobs.
Keshav is also big into fitness, with agility and acceleration-related workouts making a big part of his program due to the relevance they have in football. On top of that, he also has a more traditional strength based program for the gym, which he does to maintain an overall fitness level of his body.
Disclaimer: The information found on NewsBTC is for educational purposes only. It does not represent the opinions of NewsBTC on whether to buy, sell or hold any investments and naturally investing carries risks. You are advised to conduct your own research before making any investment decisions. Use information provided on this website entirely at your own risk.


