
-prints-classic-bullish-falling-wedge-–-big-breakout-imminent")

Reason to trust
![]()
Strict editorial policy that focuses on accuracy, relevance, and impartiality
Created by industry experts and meticulously reviewed
The highest standards in reporting and publishing
How Our News is Made
Strict editorial policy that focuses on accuracy, relevance, and impartiality
Ad discliamer
Morbi pretium leo et nisl aliquam mollis. Quisque arcu lorem, ultricies quis pellentesque nec, ullamcorper eu odio.
In an update on X, crypto analyst Jascrypto pointed out that Polkadot (DOT) is currently forming a textbook bullish falling wedge pattern on the daily chart. This technical setup is often associated with a potential trend reversal, signaling the end of a downtrend and the beginning of a bullish breakout. As DOT continues to consolidate within the narrowing bounds of the wedge, market participants are starting to take notice.
The structure suggests that bearish momentum may be weakening, allowing buyers to step in. With volume expected to increase upon a breakout, this pattern could mark a pivotal shift for DOT and spark a strong upside move, potentially starting a new bullish phase.
Why The Polkadot Falling Wedge Is Bullish
Crypto analyst Jascrypto recently highlighted that Polkadot has completed a breakout from a multi-month falling wedge pattern. Falling wedges are typically viewed as reversal patterns, and DOT’s successful breakout suggests that downward pressure may be easing after months of consolidation. This structural shift reflects growing optimism and signals that the asset could be preparing for a larger upward trend.
Jascrypto pointed out that DOT is currently testing the 100-day and 200-day Exponential Moving Averages (EMAs), key technical levels that often act as strong resistance in bearish conditions. He emphasized that a decisive daily close above these EMAs would validate the breakout and signal a shift in market sentiment.
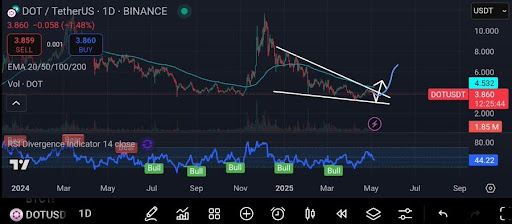
According to Jascrypto, if Polkadot maintains momentum and closes above these critical levels, it may pave the way for a rally toward the $5.5 to $6.0 range in the near term. This move would mark a significant recovery phase for DOT, attracting fresh bullish interest from investors.
In an alternative scenario, Jascrypto noted that the worst-case outcome might see Polkadot dipping as low as $3.120 on higher timeframes. However, he added that such a move could set the stage for a much stronger rebound, propelling the price above the $7 mark once momentum returns.
Momentum Indicators Lean Bullish – Is DOT Ready To Run?
Momentum indicators are beginning to align in favor of the bulls, offering promising signals that Polkadot may be gearing up for a meaningful move higher. The 4-hour Relative Strength Index (RSI) has rebounded from oversold territory, hovering near the midpoint around 50. This shift indicates that bearish momentum is fading, and buyers may be gradually regaining control.
Adding to the optimistic trend, the 4-hour Moving Average Convergence Divergence (MACD) has shown a bullish crossover, where the MACD line crosses above the signal line. A move that often marks the beginning of a new uptrend or a pause in prior downside pressure. Combined, the RSI’s recovery and the MACD’s bullish signal suggest that DOT’s momentum is shifting favorably, setting the stage for a potential breakout continuation if price action remains strong.
Featured image from Medium, chart from Tradingview.com

My name is Godspower Owie, and I was born and brought up in Edo State, Nigeria. I grew up with my three siblings who have always been my idols and mentors, helping me to grow and understand the way of life.
My parents are literally the backbone of my story. They’ve always supported me in good and bad times and never for once left my side whenever I feel lost in this world. Honestly, having such amazing parents makes you feel safe and secure, and I won’t trade them for anything else in this world.
I was exposed to the cryptocurrency world 3 years ago and got so interested in knowing so much about it. It all started when a friend of mine invested in a crypto asset, which he yielded massive gains from his investments.
When I confronted him about cryptocurrency he explained his journey so far in the field. It was impressive getting to know about his consistency and dedication in the space despite the risks involved, and these are the major reasons why I got so interested in cryptocurrency.
Trust me, I’ve had my share of experience with the ups and downs in the market but I never for once lost the passion to grow in the field. This is because I believe growth leads to excellence and that’s my goal in the field. And today, I am an employee of Bitcoinnist and NewsBTC news outlets.
My Bosses and co-workers are the best kinds of people I have ever worked with, in and outside the crypto landscape. I intend to give my all working alongside my amazing colleagues for the growth of these companies.
Sometimes I like to picture myself as an explorer, this is because I like visiting new places, I like learning new things (useful things to be precise), I like meeting new people – people who make an impact in my life no matter how little it is.
One of the things I love and enjoy doing the most is football. It will remain my favorite outdoor activity, probably because I’m so good at it. I am also very good at singing, dancing, acting, fashion and others.
I cherish my time, work, family, and loved ones. I mean, those are probably the most important things in anyone’s life. I don’t chase illusions, I chase dreams.
I know there is still a lot about myself that I need to figure out as I strive to become successful in life. I’m certain I will get there because I know I am not a quitter, and I will give my all till the very end to see myself at the top.
I aspire to be a boss someday, having people work under me just as I’ve worked under great people. This is one of my biggest dreams professionally, and one I do not take lightly. Everyone knows the road ahead is not as easy as it looks, but with God Almighty, my family, and shared passion friends, there is no stopping me.
Disclaimer: The information found on NewsBTC is for educational purposes only. It does not represent the opinions of NewsBTC on whether to buy, sell or hold any investments and naturally investing carries risks. You are advised to conduct your own research before making any investment decisions. Use information provided on this website entirely at your own risk.


