


Reason to trust
![]()
Strict editorial policy that focuses on accuracy, relevance, and impartiality
Created by industry experts and meticulously reviewed
The highest standards in reporting and publishing
How Our News is Made
Strict editorial policy that focuses on accuracy, relevance, and impartiality
Ad discliamer
Morbi pretium leo et nisl aliquam mollis. Quisque arcu lorem, ultricies quis pellentesque nec, ullamcorper eu odio.
Ethereum is trading just below the $2,000 mark, holding at critical levels as the broader market shows signs of recovery. After weeks of choppy price action and fading selling pressure, bulls are gradually regaining control, pushing ETH into a more bullish short-term structure. Momentum is building as Ethereum stabilizes above the $1,800 level, and technical indicators suggest a breakout may be forming.
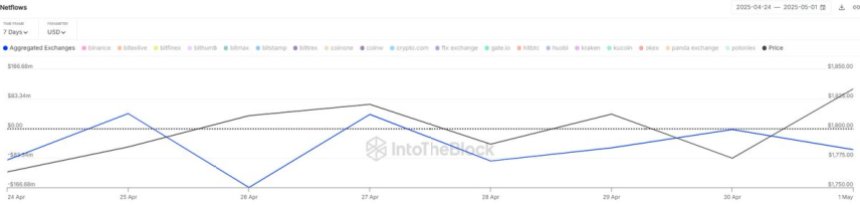
Adding to the growing optimism, on-chain data from IntoTheBlock shows a consistent flow of ETH out of centralized exchanges—an indicator often associated with accumulation and reduced sell-side pressure. Over the past week alone, net outflows have exceeded $380 million worth of Ethereum, reinforcing the view that investors are preparing for a move higher.
Still, the key resistance at $2,000 remains a psychological and technical barrier. A confirmed push above this level could trigger a broader altcoin rally and signal the start of Ethereum’s next leg up. Until then, the market remains cautiously optimistic as bulls test the upper limits of this consolidation zone, looking for the momentum needed to escape it.
Ethereum Faces Critical Test Amid Accumulation Trend
Ethereum continues to face headwinds as it trades more than 55% below its December highs, hovering beneath the $2,000 resistance zone. While the broader crypto market shows signs of revival, ETH remains locked in a critical battle between supply overhead and renewed buying interest. The recent price structure shows some bullish development in lower time frames, as buyers attempt to build momentum. However, strong resistance levels still loom, and failure to break through could trigger a fresh move into lower demand zones around $1,700 or even $1,500.
Despite these technical challenges, on-chain data paints a more encouraging picture. According to IntoTheBlock, centralized exchanges have seen net Ethereum outflows of roughly $380 million over the last seven days. This steady reduction in exchange-held ETH suggests a growing trend of accumulation, often interpreted as investors moving coins to cold storage rather than preparing to sell. This behavior typically reduces sell-side pressure and can lay the groundwork for more sustainable rallies.
Market sentiment remains mixed. Some analysts argue that Ethereum is gearing up for a breakout, with shifting momentum hinting at an imminent surge. Others remain cautious, warning that macroeconomic uncertainty and fragile investor confidence could still pull ETH into a deeper correction. The coming days will be crucial in defining Ethereum’s trajectory.
ETH Price Analysis: Testing Key Resistance
Ethereum (ETH) is currently trading at $1,837 after several days of consolidation just below the $1,850 level. As seen in the daily chart, ETH has been attempting to form a short-term bullish structure after rebounding from April lows near $1,550. The price has steadily climbed but now faces significant resistance near $1,850—a level that has acted as both support and resistance in previous months.
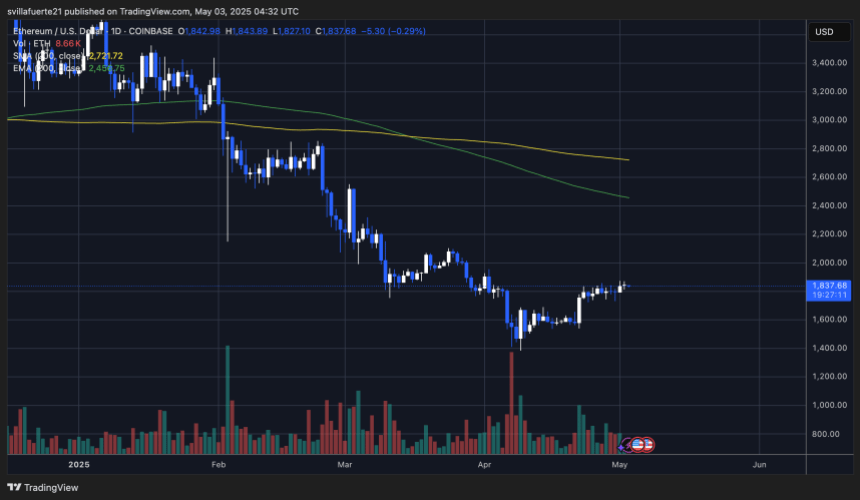
Volume has been relatively stable but not convincingly high, indicating that bulls are gaining control but lack strong momentum to break through. The 200-day Simple Moving Average (SMA) at $2,271 and the 200-day Exponential Moving Average (EMA) at $2,456 remain distant overhead targets. These levels represent key longer-term resistance, and reclaiming them would be a major bullish signal.
For now, ETH must close decisively above $1,850 to validate this short-term trend reversal. A failure to do so may result in another retest of support around $1,700 or even lower, particularly if broader market sentiment shifts. However, the price holding above recent swing lows and forming higher lows signals that bullish pressure is building gradually. A breakout above $1,850 would open the door to a move toward the $2,000–$2,200 zone.
Featured image from Dall-E, chart from TradingView

Sebastian’s journey into the world of crypto began four years ago, driven by a fascination with the potential of blockchain technology to revolutionize financial systems. His initial exploration focused on understanding the intricacies of various crypto projects, particularly those focused on building innovative financial solutions. Through countless hours of research and learning, Sebastian developed a deep understanding of the underlying technologies, market dynamics, and potential applications of cryptocurrencies.
To share his insights with others, Sebastian became an active contributor to online discussions on platforms like X and LinkedIn. His focus on fintech and crypto-related topics quickly established him as a trusted voice in the online crypto community. Sebastian’s goal was to educate and inform his audience about the latest trends and insights in the rapidly evolving crypto landscape.
To further enhance his expertise, Sebastian pursued a UC Berkeley Fintech: Frameworks, Applications, and Strategies certification. This rigorous program equipped him with valuable skills and knowledge regarding Financial Technology, bridging the gap between traditional finance and decentralized finance. The certification deepened his understanding of the broader financial landscape and its intersection with blockchain technology.
Sebastian’s passion for finance and writing is evident in his work. He enjoys delving into financial research, analyzing market trends, and exploring the latest developments in the crypto space. In his spare time, Sebastian can often be found immersed in charts, studying 10-K reports, or engaging in thought-provoking discussions about the future of finance.
Sebastian’s journey as a crypto pioneer has been marked by a relentless pursuit of knowledge and a dedication to sharing his insights. His ability to navigate the complex world of crypto, combined with his passion for financial research and communication, makes him a valuable contributor to the industry. As the crypto landscape continues to evolve, Sebastian remains at the forefront, providing valuable insights and helping to shape the future of this revolutionary technology.
Disclaimer: The information found on NewsBTC is for educational purposes only. It does not represent the opinions of NewsBTC on whether to buy, sell or hold any investments and naturally investing carries risks. You are advised to conduct your own research before making any investment decisions. Use information provided on this website entirely at your own risk.


