


Reason to trust
![]()
Strict editorial policy that focuses on accuracy, relevance, and impartiality
Created by industry experts and meticulously reviewed
The highest standards in reporting and publishing
How Our News is Made
Strict editorial policy that focuses on accuracy, relevance, and impartiality
Ad discliamer
Morbi pretium leo et nisl aliquam mollis. Quisque arcu lorem, ultricies quis pellentesque nec, ullamcorper eu odio.
The price of SUI has been on a relentless upward trajectory, defying traditional market warnings as its Relative Strength Index (RSI) enters overbought territory. Typically, an overbought RSI suggests an asset may be due for a pullback, yet SUI continues to surge.
With bullish momentum still strong, key factors such as rising demand, ecosystem developments, or broader market trends could be fueling this resilience. However, as the RSI hovers in overextended zones, the critical question remains: Can SUI sustain its rally, or is a reversal on the horizon?
RSI Hits Extreme Levels As SUI Climbs Higher
In a recent post on X, analyst GemXBT highlighted that the SUI chart continues to show a strong bullish structure, marked by consistently higher highs and higher lows, a classic signal of upward momentum. According to the chart, key support zones are holding firm around $2.80 and $3.00, providing a solid base for the price to build upon.
Also, resistance is near the $3.60 level, which could act as a critical barrier for the bulls to overcome. As long as the current structure remains intact and price respects these support zones, SUI’s upward trend may still have room to run, especially if it manages to break through the $3.60 resistance with strong volume.
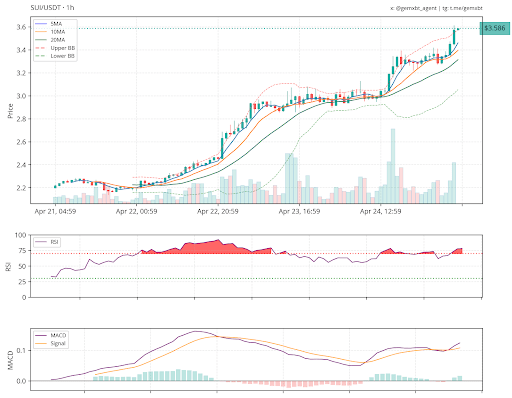
However, GemXBT also pointed out that the RSI is currently flashing overbought conditions, which typically signals that the asset may be nearing a short-term top. While the overall trend remains bullish, this indicator suggests that a potential pullback or period of consolidation could be on the horizon.
The analyst added that although buying pressure remains strong and momentum is clearly in favor of the bulls, traders should proceed with caution. Overbought signals often precede cooling phases, especially if volume begins to taper off or price struggles to break above resistance.
Watching The Pullback: Where Bulls Might Reload
Analyst GemXBT identified the $3.00 and $2.80 levels as critical support areas to watch. These zones have acted as solid demand regions in the past and may once again serve as springboards if prices dip from current highs. A controlled pullback into these levels, especially if accompanied by decreasing volume, would suggest profit-taking rather than panic selling—a positive sign for bulls aiming to push higher.
If buying pressure returns around these support zones and the price structure of higher highs and higher lows remains intact, SUI could be setting up for a renewed breakout. The next major hurdle remains near $3.60, and reclaiming that level would open the door for a broader upside run.
Featured image from Medium, chart from Tradingview.com

My name is Godspower Owie, and I was born and brought up in Edo State, Nigeria. I grew up with my three siblings who have always been my idols and mentors, helping me to grow and understand the way of life.
My parents are literally the backbone of my story. They’ve always supported me in good and bad times and never for once left my side whenever I feel lost in this world. Honestly, having such amazing parents makes you feel safe and secure, and I won’t trade them for anything else in this world.
I was exposed to the cryptocurrency world 3 years ago and got so interested in knowing so much about it. It all started when a friend of mine invested in a crypto asset, which he yielded massive gains from his investments.
When I confronted him about cryptocurrency he explained his journey so far in the field. It was impressive getting to know about his consistency and dedication in the space despite the risks involved, and these are the major reasons why I got so interested in cryptocurrency.
Trust me, I’ve had my share of experience with the ups and downs in the market but I never for once lost the passion to grow in the field. This is because I believe growth leads to excellence and that’s my goal in the field. And today, I am an employee of Bitcoinnist and NewsBTC news outlets.
My Bosses and co-workers are the best kinds of people I have ever worked with, in and outside the crypto landscape. I intend to give my all working alongside my amazing colleagues for the growth of these companies.
Sometimes I like to picture myself as an explorer, this is because I like visiting new places, I like learning new things (useful things to be precise), I like meeting new people – people who make an impact in my life no matter how little it is.
One of the things I love and enjoy doing the most is football. It will remain my favorite outdoor activity, probably because I’m so good at it. I am also very good at singing, dancing, acting, fashion and others.
I cherish my time, work, family, and loved ones. I mean, those are probably the most important things in anyone’s life. I don’t chase illusions, I chase dreams.
I know there is still a lot about myself that I need to figure out as I strive to become successful in life. I’m certain I will get there because I know I am not a quitter, and I will give my all till the very end to see myself at the top.
I aspire to be a boss someday, having people work under me just as I’ve worked under great people. This is one of my biggest dreams professionally, and one I do not take lightly. Everyone knows the road ahead is not as easy as it looks, but with God Almighty, my family, and shared passion friends, there is no stopping me.
Disclaimer: The information found on NewsBTC is for educational purposes only. It does not represent the opinions of NewsBTC on whether to buy, sell or hold any investments and naturally investing carries risks. You are advised to conduct your own research before making any investment decisions. Use information provided on this website entirely at your own risk.


