


Reason to trust
![]()
Strict editorial policy that focuses on accuracy, relevance, and impartiality
Created by industry experts and meticulously reviewed
The highest standards in reporting and publishing
How Our News is Made
Strict editorial policy that focuses on accuracy, relevance, and impartiality
Ad discliamer
Morbi pretium leo et nisl aliquam mollis. Quisque arcu lorem, ultricies quis pellentesque nec, ullamcorper eu odio.
SUI is making another attempt to break past the crucial $2.82 resistance, a level that has repeatedly challenged bullish momentum. After a steady climb, the price now stands at a decisive point—will buyers have enough strength to push through, or will sellers step in to defend this barrier once again?
Recent price action suggests that positive sentiment is gaining traction, with increasing trading volumes and strong support levels forming beneath. However, past attempts to breach $2.82 have resulted in pullbacks, making this level a significant test for the market. A confirmed breakout could trigger a fresh rally to higher targets, while failure to overcome this hurdle may lead to renewed selling pressure.
Chart Patterns And Technical Indicators: Signs Of A Breakout?
SUI price action is showing promising signs of an impending breakout as it continues to test the critical $2.82 resistance level. Looking closer at the chart reveals the formation of bullish ascending candlesticks, a pattern characterized by higher lows and a steady resistance ceiling. This structure suggests that buyers are building momentum, increasing the likelihood of an upward breakout.
Technical indicators further support this outlook. The Relative Strength Index (RSI) has climbed above 50, while the Moving Average Convergence Divergence (MACD) has shown a bullish crossover. Additionally, trading volume is rising, a key factor often preceding a breakout move.
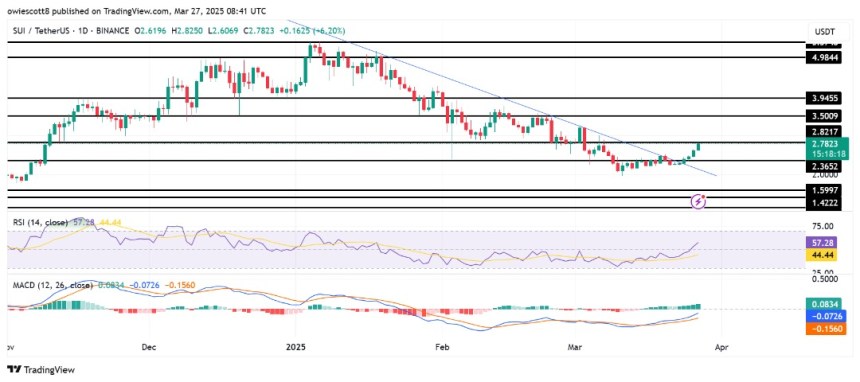
The price has also broken above the bearish trendline, signaling a potential shift in market sentiment. This breakout suggests that selling pressure is weakening, allowing buyers to regain control. A successful breakout from a bearish trendline usually indicates the end of a downtrend and the beginning of a possible upward movement.
If SUI surpasses the critical $2.82 resistance level with a strong trading volume, it could ignite a significant rally, pushing the price toward $3.50 and beyond. Breaking above this level would indicate that buyers have gained control, invalidating previous resistance and setting the stage for further upside momentum.
Rejection And Possible Pullback Levels For SUI
While SUI’s bullish strength is building, the $2.82 resistance remains a formidable barrier, and failure to break above it might lead to a downside move. If buyers fail to sustain momentum, sellers may step in, triggering a rejection that could send the price back toward key support levels.
The first critical support to watch lies around $2.36, a level where buyers previously defended against deeper declines. If selling pressure intensifies, SUI could drop toward $1.59. A break below this level may expose the price to deeper corrections, with $1.42 acting as a crucial defense zone for bulls.
Featured image from YouTube, chart from Tradingview.com

My name is Godspower Owie, and I was born and brought up in Edo State, Nigeria. I grew up with my three siblings who have always been my idols and mentors, helping me to grow and understand the way of life.
My parents are literally the backbone of my story. They’ve always supported me in good and bad times and never for once left my side whenever I feel lost in this world. Honestly, having such amazing parents makes you feel safe and secure, and I won’t trade them for anything else in this world.
I was exposed to the cryptocurrency world 3 years ago and got so interested in knowing so much about it. It all started when a friend of mine invested in a crypto asset, which he yielded massive gains from his investments.
When I confronted him about cryptocurrency he explained his journey so far in the field. It was impressive getting to know about his consistency and dedication in the space despite the risks involved, and these are the major reasons why I got so interested in cryptocurrency.
Trust me, I’ve had my share of experience with the ups and downs in the market but I never for once lost the passion to grow in the field. This is because I believe growth leads to excellence and that’s my goal in the field. And today, I am an employee of Bitcoinnist and NewsBTC news outlets.
My Bosses and co-workers are the best kinds of people I have ever worked with, in and outside the crypto landscape. I intend to give my all working alongside my amazing colleagues for the growth of these companies.
Sometimes I like to picture myself as an explorer, this is because I like visiting new places, I like learning new things (useful things to be precise), I like meeting new people – people who make an impact in my life no matter how little it is.
One of the things I love and enjoy doing the most is football. It will remain my favorite outdoor activity, probably because I’m so good at it. I am also very good at singing, dancing, acting, fashion and others.
I cherish my time, work, family, and loved ones. I mean, those are probably the most important things in anyone’s life. I don’t chase illusions, I chase dreams.
I know there is still a lot about myself that I need to figure out as I strive to become successful in life. I’m certain I will get there because I know I am not a quitter, and I will give my all till the very end to see myself at the top.
I aspire to be a boss someday, having people work under me just as I’ve worked under great people. This is one of my biggest dreams professionally, and one I do not take lightly. Everyone knows the road ahead is not as easy as it looks, but with God Almighty, my family, and shared passion friends, there is no stopping me.
Disclaimer: The information found on NewsBTC is for educational purposes only. It does not represent the opinions of NewsBTC on whether to buy, sell or hold any investments and naturally investing carries risks. You are advised to conduct your own research before making any investment decisions. Use information provided on this website entirely at your own risk.


