


Reason to trust
![]()
Strict editorial policy that focuses on accuracy, relevance, and impartiality
Created by industry experts and meticulously reviewed
The highest standards in reporting and publishing
How Our News is Made
Strict editorial policy that focuses on accuracy, relevance, and impartiality
Ad discliamer
Morbi pretium leo et nisl aliquam mollis. Quisque arcu lorem, ultricies quis pellentesque nec, ullamcorper eu odio.
After hitting a low of nearly $76,000 on March 10, Bitcoin (BTC) has finally broken its daily Relative Strength Index (RSI) downtrend, now trading in the high $80,000s at the time of writing. However, crypto analyst Ali Martinez warns that strong resistance may lie ahead.
Bitcoin Finally Breaks Daily RSI Downtrend
In a recent X post, crypto analyst Rekt Capital highlighted that BTC has broken through a multi-month RSI downtrend. The analyst shared a Bitcoin daily chart, showing how the leading cryptocurrency’s RSI has broken free from a prolonged downtrend that began at the start of the year.
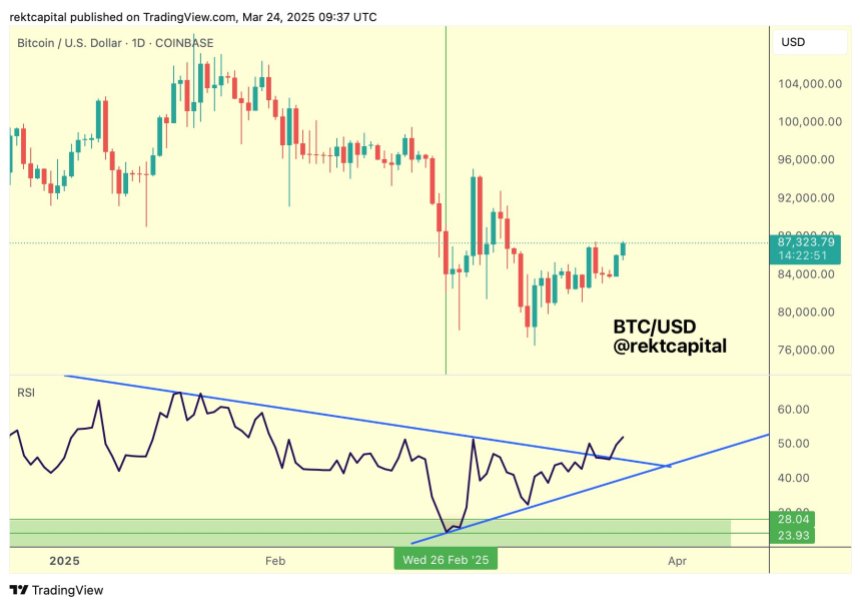
For the uninitiated, the RSI is a momentum indicator that suggests when the underlying asset – in this case, BTC – may be overbought or oversold. A rising RSI after sustained downtrend can indicate growing bullish momentum and a possible trend reversal.
Fellow crypto analyst Merlijn The Trader echoed Rekt Capital’s analysis, stating that the RSI breakout confirms bullish momentum and could pave the way for a significant price rally.

Another key indicator turned bullish this week – the Bitcoin Hash Ribbons. In an X post, crypto analyst Robert Mercer noted:
One of the most accurate mid-term indicator is bullish now. Expecting BTC to go back above $100,000 in Q2 of 2025!
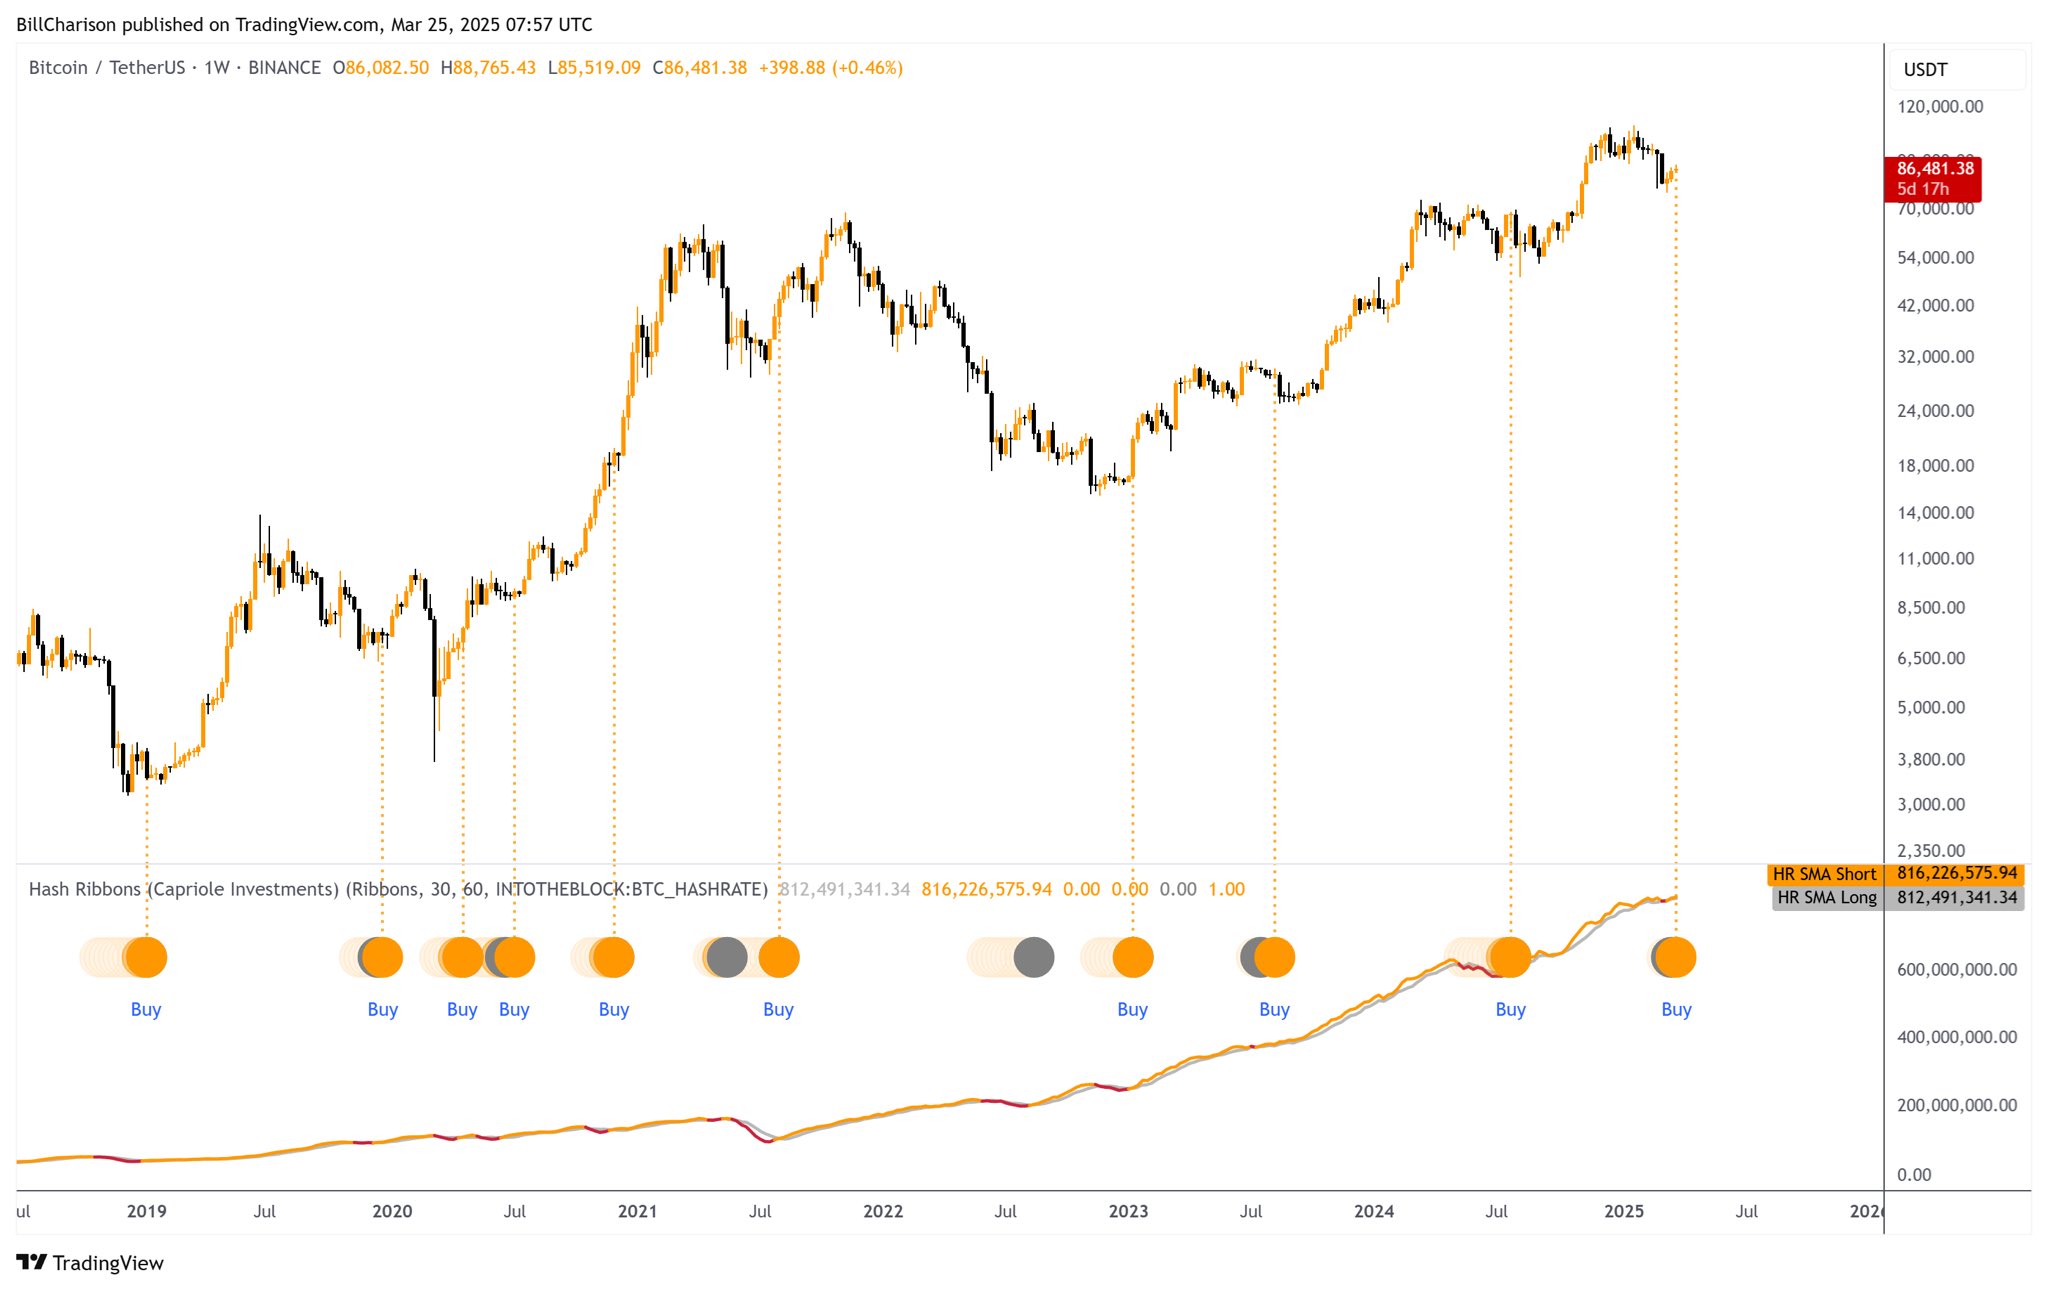
To explain, the Hash Ribbons indicator turning bullish signals that Bitcoin miners – after a period of capitulation – are returning to the network, suggesting mining recovery and reduced selling pressure. This often marks a strong buy signal, and has historically aligned with the end of bear markets and the start of new uptrends.
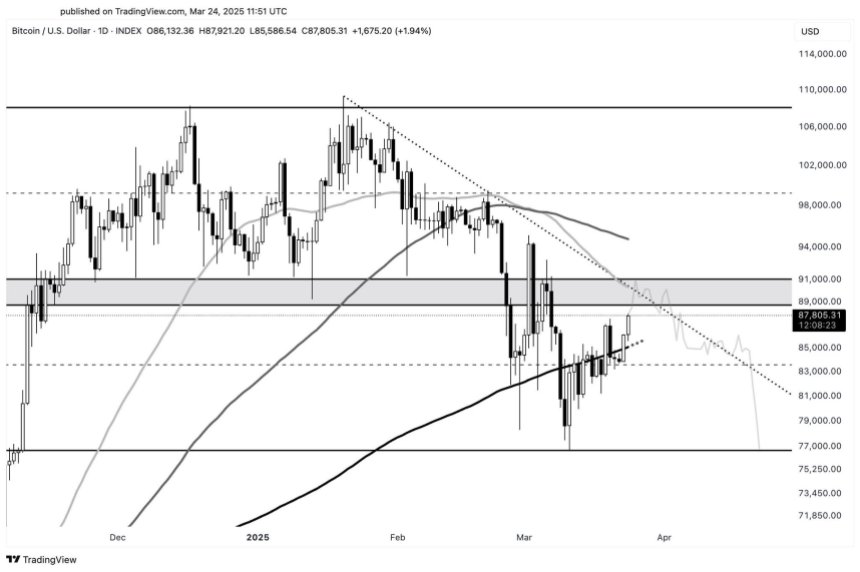
Analyst Warns Of Stiff Resistance Ahead
Despite BTC’s more than 15% surge from its March 10 low, seasoned analyst Ali Martinez cautions that the top digital asset is likely to encounter strong resistance around the $89,000 level. Martinez explained:
Bitcoin $BTC faces a key resistance cluster at $89,000, where the 50-day moving average and the descending trendline from the all-time high converge.
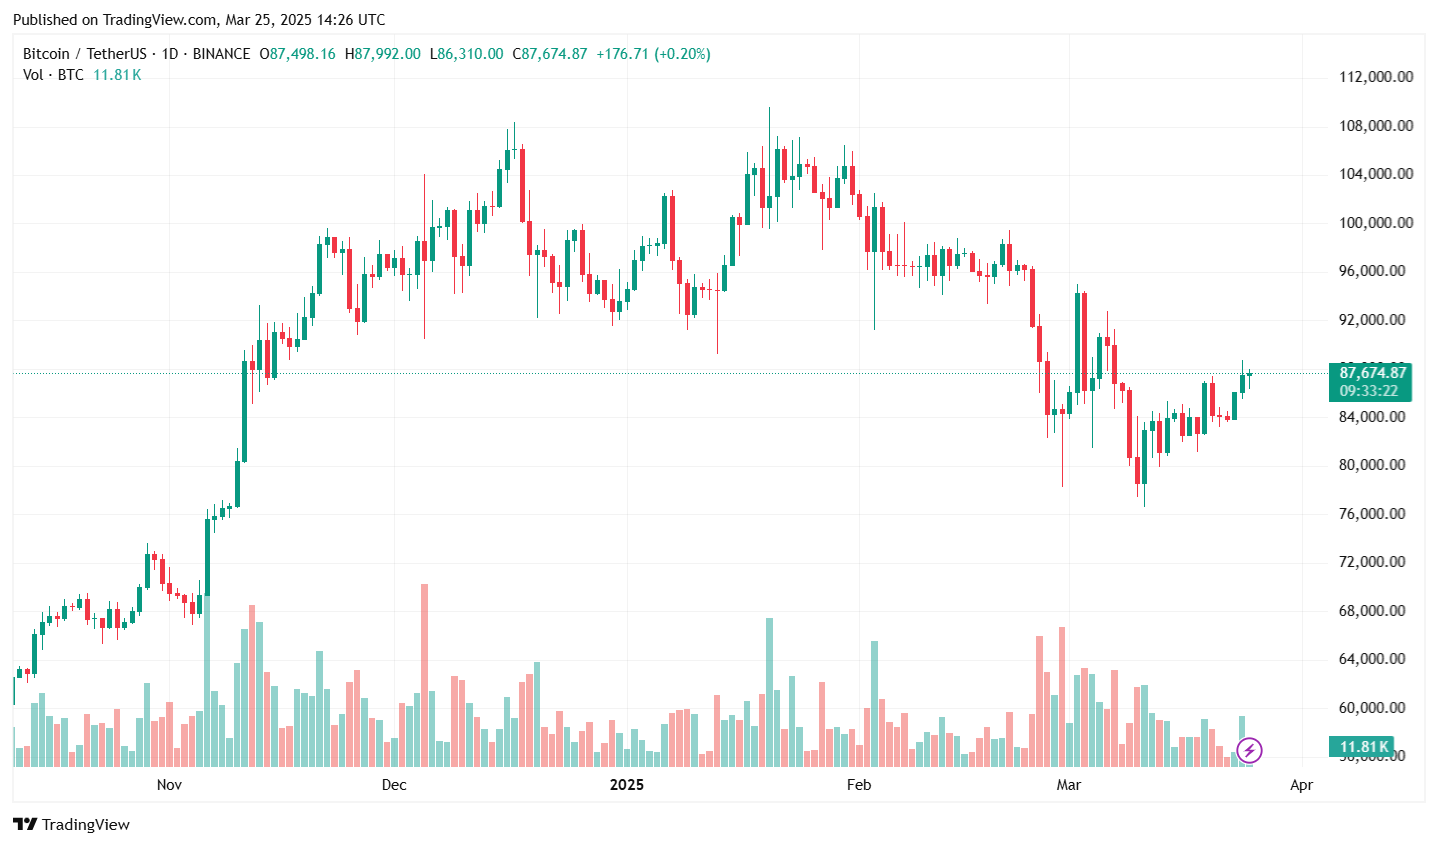
That said, several positive macroeconomic factors could support BTC’s bullish momentum. In a recent analysis, crypto analyst The M2 Guy emphasized that the expanding M2 money supply is likely to benefit risk-on assets like BTC.
However, other cryptocurrency analysts – such as Maartunn – argued that BTC must decisively clear the $87,000 price level to have a shot at sustained upward price movement. At press time, BTC trades at $87,674, down 0.7% in the past 24 hours.
Featured image from Unsplash, Charts from X and TradingView.com

Ash is a dedicated crypto researcher and blockchain enthusiast with a passion for diving deep into the evolving world of decentralized technologies. With a background in writing and a natural curiosity for how digital assets are shaping the future, he has immersed himself in various sectors of the cryptocurrency space, including decentralized finance (DeFi), NFTs, and liquidity mining. His journey into crypto started with a desire to fully understand the technology behind it, leading him to explore and engage with these systems firsthand.
Ash’s approach to DeFi goes beyond surface-level research as he actively participates in decentralized protocols, testing their functionality to gain a deeper understanding of how they operate. From experimenting with staking mechanisms to exploring liquidity mining strategies, he is hands-on in his exploration, which allows him to provide practical, real-world insights that go far beyond theoretical knowledge. This immersive experience has helped him develop a comprehensive grasp of smart contracts, token governance, and the broader implications of decentralized platforms on the future of finance.
In the NFT space, Ash’s interest is driven by the technology’s potential to reshape ownership and creativity in the digital age. He has explored various NFT projects, gaining insights into how these digital assets function within different ecosystems. His focus is on understanding the evolving relationship between creators and communities, as well as the innovative uses of blockchain technology to establish authenticity and provenance in the digital world. Ash’s research in this area often touches on the intersection of culture, technology, and community-driven projects.
A key area of his expertise lies in liquidity mining, where he has engaged with various decentralized platforms to understand how liquidity provision contributes to the functionality and security of DeFi ecosystems. Ash’s hands-on involvement has allowed him to analyze the risks, rewards, and broader implications of liquidity pools, giving him a well-rounded perspective on this integral part of DeFi. His understanding of risk management and protocol design allows him to provide insights into how these systems can be navigated effectively, with an emphasis on both opportunity and caution.
When it comes to communicating these complex topics, Ash’s writing is grounded in clarity and depth. He excels at breaking down intricate blockchain concepts into easily digestible information for a wide audience. Whether explaining the workings of decentralized exchanges or outlining the future potential of blockchain technology, Ash ensures that his content is accessible to both those new to the space and experienced participants looking for deeper insights.
Beyond DeFi and NFTs, Ash explores a wide array of emerging blockchain applications. His research spans areas like cross-chain technologies, decentralized governance, and blockchain’s potential to integrate with traditional finance. He is continuously learning and adapting to the latest developments, ensuring that his insights are both timely and relevant. His interest extends to how these technologies are creating new possibilities for decentralization, transparency, and trust in a variety of industries.
Ash’s commitment to engaging with the crypto space firsthand gives him a unique perspective that goes beyond what can be learned from research alone. His practical involvement allows him to stay ahead of the curve, offering readers and enthusiasts a clear and comprehensive understanding of the rapidly evolving world of blockchain. Whether delving into the technical mechanics of DeFi or exploring the cultural impact of NFTs, Ash’s approach is always rooted in curiosity, research, and a desire to make this technology accessible to all.
Disclaimer: The information found on NewsBTC is for educational purposes only. It does not represent the opinions of NewsBTC on whether to buy, sell or hold any investments and naturally investing carries risks. You are advised to conduct your own research before making any investment decisions. Use information provided on this website entirely at your own risk.


